
Sauvetage de données météorologiques historiques avec l’initiative SAM (Sauvetage d’archives météorologiques) de l’Université McGill, au Canada et ailleurs
– Par Victoria Slonosky, l’Université McGill, Montreal, Canada –
Pour comprendre l’évolution du climat, nous devons connaître son état passé. Les archives météorologiques sont la meilleure source d’information, et la plus détaillée, en ce qui concerne les changements climatiques et les événements météorologiques extrêmes des dernières dizaines et centaines d’années.
Résumé
Au Canada, nous avons la chance d’avoir une mine d’or de données météorologiques s’étendant sur plus de trois siècles. Toutefois, bon nombre de ces relevés n’existent encore qu’en format papier et ne peuvent donc servir à des fins scientifiques. Le « sauvetage de données » consiste à localiser les données d’archives et à les transformer en un format lisible par machine. Des groupes du monde entier liés à de nombreux domaines des géosciences entreprennent de transformer des milliards d’observations passées en données utilisables. L’initiative SAM (Sauvetage d’archives météorologiques) de l’Université McGill vise à sauver les observations météorologiques issues de l’Observatoire de McGill (1864-1963). Cette tâche, avec des millions d’observations consignées sur des milliers de pages pendant un siècle, est énorme. Le SAM compte sur la participation du public (crowdsourcing) en construisant un site Web où les citoyens volontaires peuvent se rendre pour connaître notre patrimoine scientifique et participer au sauvetage de nos observations météorologiques historiques.
Certains résultats obtenus à partir de données d’archives enregistrées dans la vallée du Saint-Laurent laissent penser à une volatilité accrue du climat au début du XIXe siècle, avec un nombre élevé de canicules ainsi que de vagues de froid au cours des premières décennies de ce siècle. Les résultats très préliminaires fondés sur certaines données émanant du SAM indiquent une curieuse possibilité de niveaux élevés de particules atmosphériques ou de pollution à la fin du XIXe siècle. Enfin, comme les observateurs météorologiques ont aussi consigné la description de phénomènes météorologiques en plus des relevés d’instruments, nous voyons comment l’évolution de conditions météorologiques particulières, la poudrerie par exemple, a changé au fil du temps. Ces résultats laissent penser que tandis que les observations manuelles sont généralement comparables dans le temps, les changements récents apportés aux pratiques d’observation (stations météorologiques automatiques ou traitement des données) pourraient générer des données incompatibles avec des centaines d’années de relevés passés.
As we continue learning about our weather and climate, and perhaps especially as we learn what we don’t yet know, the importance of real-world data and observations becomes ever more apparent. Astonishing feats of physics, mathematics and computing go into modelling of various kinds, including data synthesis, understanding of processes, and short-and long-term forecasting, but science progresses only by holding a constant conversation between theoretical models and observations. Climate, meteorology and the geosciences are largely historical rather than experimental sciences, in the sense that events occur only once in real time on our actual planet. We observe the weather as it happens, and these measurements provide us with our weather and climate data. These observations are then used to further our understanding of extreme events, weather hazards and climatic variability and change. Historical data are thus extremely important, in that they provide us with our only record of actual weather and climate.
At the 2019 IUGG and concomitant CMOS annual meeting in Montreal this past July, the Joint Session “Old Data for New Knowledge, ” organized by Josep Batllo (Institut Cartogràfic i Geològic de Catalunya Spain), and chaired by both him and Kristine Harper (University of Florida), brought together researchers across the geosciences, showing how historical data and records are being used in disciplines across the geosciences to better our understanding of past and current events, from the everyday to the extremely hazardous. Measurements and descriptions of solar magnetic storms capable of disrupting modern communications and infrastructures, community destroying medieval floods, and devasting volcanoes and earthquakes are all locked in mainly paper sources such as technical scientific literature, ships’ logs, written documents (including tax accounts and other official records) , and instrumental records such as seismograms. Many of these date back centuries. What they all have in common is that, in Prof. Batllo’s definition of historical data, the data they contain “are not available in present form for immediate use.”
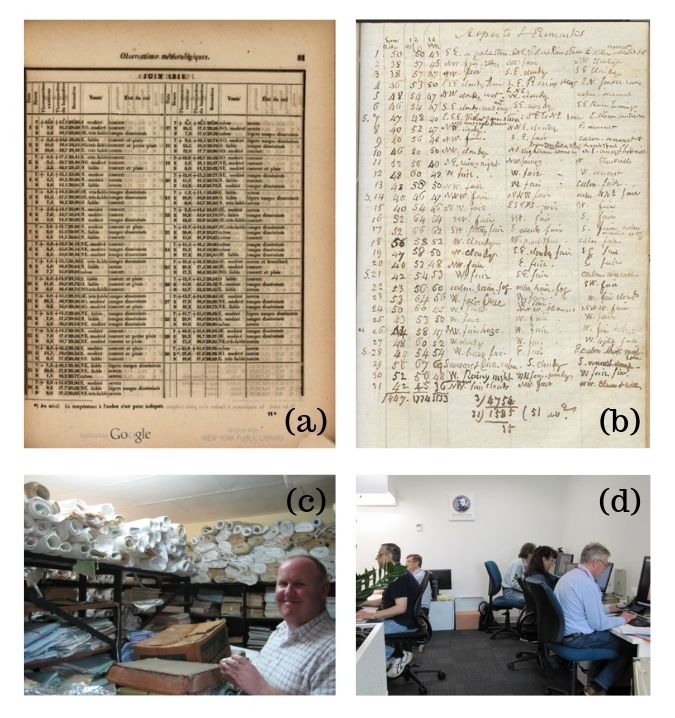
In the field of weather and climate, researchers around the world have been working to recover and analyse weather observations from historical documents (Figure 1). Those working in this field range from national meteorological services and university researchers and groups to dedicated individuals and even charitable organizations (Fig.1c). Volunteers also play a large role in weather data rescue, from small groups meeting together (Fig 1d) to thousands of people going online to type in weather observations in crowdsourced citizen science projects. Once a year, historical weather and climate data researchers meet either in person or over the web at annual ACRE (Atmospheric Circulation Reconstructions over the Earth; Allan et al 2011) meetings. ACRE, led by Rob Allan from the UK Met Office, serves as an umbrella organization for data rescue efforts around the globe.
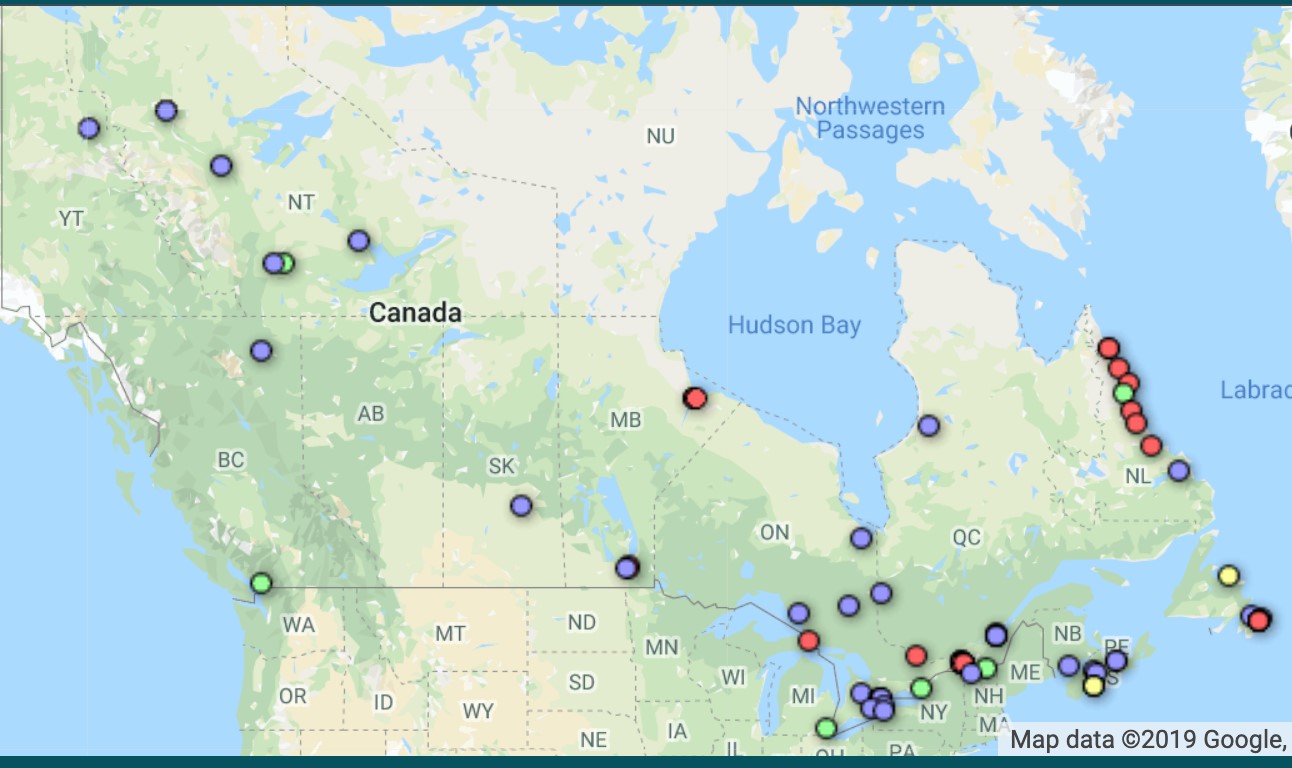
Here in Canada, systematic weather observations from the St Lawrence Valley region go back to the mid 18th century and were made digitally readable in an earlier citizen science project supported by CMOS volunteers (see the October 2011 issue). Historical weather data rescue and analysis for locations across the country is supported by a blend of sponsored and volunteer, citizen-science based research. Support from Environment and Climate Change Canada has recently gone towards locating and cataloging 4475 digital images of weather observations, from 46 different locations (Figure 2), with up to 21 variables observed two or three times a day. More sporadic weather observations also exist for the Hudson Bay area from the mid 18th century onwards (K Devine, C Wilson pers. comm), while ships’ logs and explorers’ diaries also provided sources of early instrumental weather data (C. Mock, R. Allen pers. comm).
The challenge of turning millions of 19th and early 20th century handwritten meteorological observations into machine-readable bytes that can be used for scientific analysis is a formidable one. At McGill University, an interdisciplinary team comprised of archivists, information specialists, geographers and citizen engagement analysts, software developers, meteorologists and historical climatologists founded the citizen science project DRAW (Data Rescue: Archives and Weather) to find a way to get the historical records of the McGill Observatory transcribed into digital data.
The McGill Observatory was founded in 1863 by Dr Charles Smallwood and was formally incorporated into the Meteorological Service of Canada in 1874. Professors, students and later formal observers recorded anywhere from 40 observations nine time a day in the 1880 to 55 observations twice a day by the 1930s. Although this adds up to a potential of nine and half million unique weather observations, not all the variables on the printed sheet were regularly recorded while others, such as rain or snow, were left blank when there was no precipitation. The actual number of observations to transcribe is likely less than six million. It’s still a huge number, one far beyond the capacity of an enthusiastic but small and time-pressed band of historical weather data aficionados at McGill.
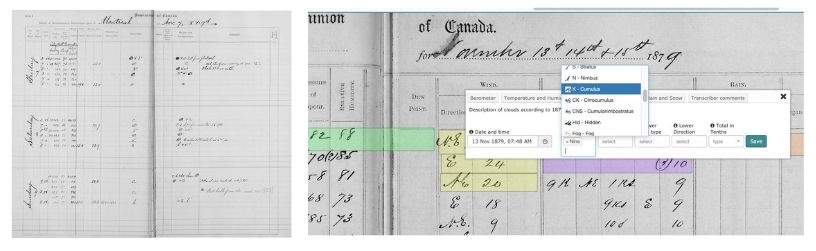
Figure 4 (right): A screenshot of the DRAW web app showing the transcription tool, with a drop-down menu to select cloud type.
Instead, we turn to citizen science, not only for help in getting McGill’s historical weather data turned into a usable format for scientific analysis, but also to make Montrealers and indeed, all Canadians, aware of our amazing scientific heritage.
For the McGill DRAW project, we are asking volunteers to log on to our website at https://citsci.geog.mcgill.ca/, choose the English or French option, go through our orientation tutorial and then start transcribing historical weather data directly into our web app using our user interface, the transcription tool.
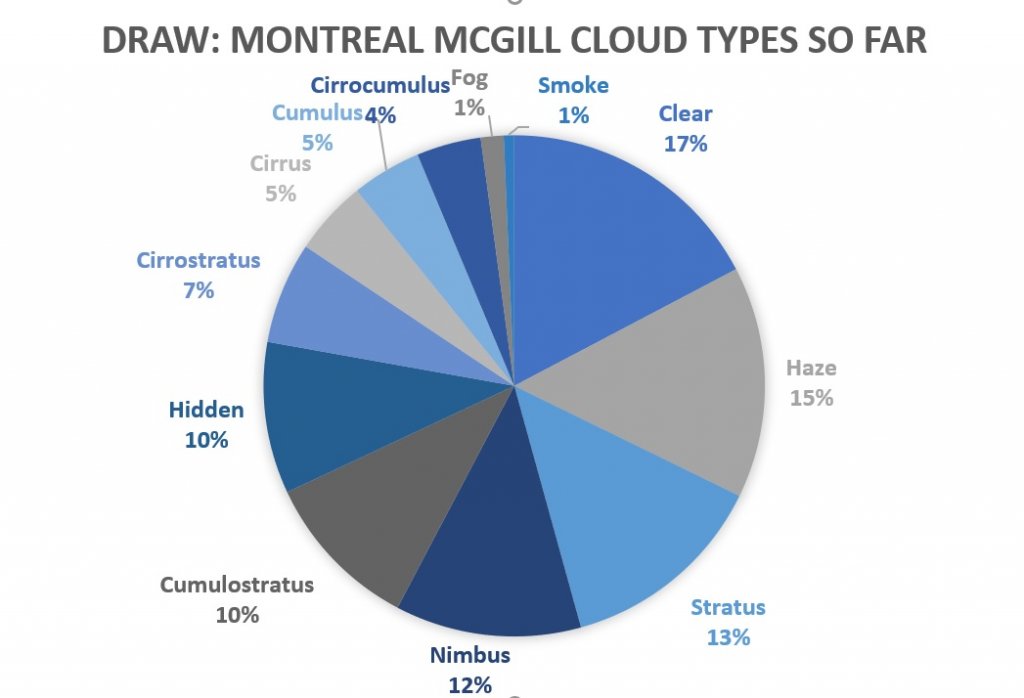
We’re aware that the McGill Observatory data set is complex. Not only are the variables observed technical and in archaic units, such as “Barometric pressure reduced to 32·F” or “hygrometer” rather than everyday terms such as air temperature and humidity, but there are variables such as cloud type abbreviations (CuST for CumuloStratus) obscure weather symbols which can’t be reproduced on a keyboard (Figure 3). We’ve spent considerable effort in making the transcription environment as easy to use as possible, with drop down selection menus to match cloud types (Figure 4), wind directions and weather symbol types, hover pop-ups with extra information, and FAQs, tutorials supporting blogs. So far, we have over 1100 pages partially or completely transcribed, with over 250 000 unique observations, including cloud type, captured so far (Figure 5).
What happens to the data once it’s typed up? One of the principal aims of ACRE is to understand the atmospheric circulation variations that drive climatic variability, change and extreme events. All of the surface pressure data captured by historical data rescue, including the Canadian volunteer projects, form part of the International Surface Pressure Databank (ISPD, Cram et al., 2015 ), which in turn is one of the major sources of initial data assimilation for the NOAA-CIRES Twentieth Century Reanalysis (20CR) dataset (Compo et al., 2011). The latest version of 20CR, version 3, is being released this summer and covers 1836-2015 (Slivinski et al., 2019). Data from the Canadian north and west are particularly valuable to help improve 20CR estimates over North America. Historical data are also being consolidated in international databanks as described by Thorne et al (2017).
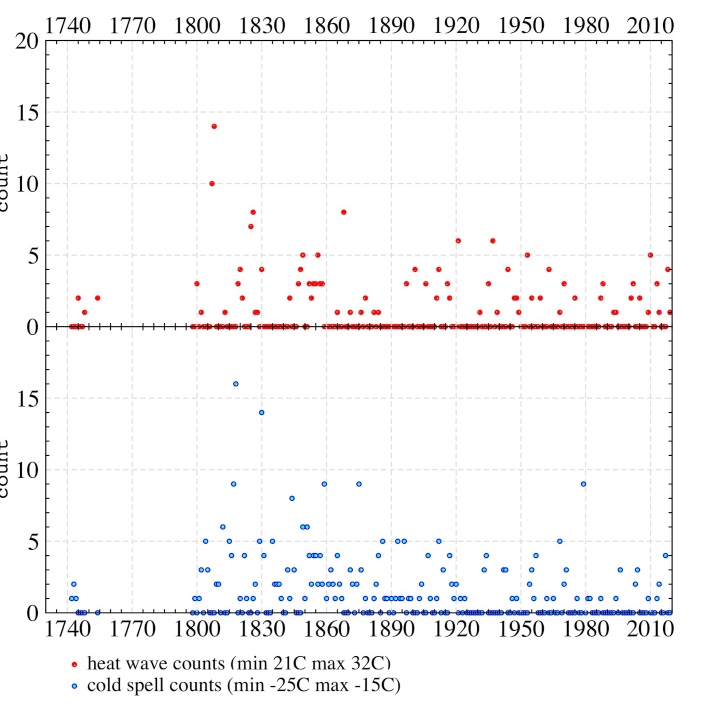
Digitized historical weather data are also used to examine climate variability and change at local and regional levels. Temperature data from the earlier Canadian volunteer data rescue for the St Lawrence Valley were analyzed and an attempt was made to consolidate the disparate individual diaries into a regional temperature record going back (with gaps) to 1742. As the original weather diaries were sub-daily, it’s possible to examine in great detail short term events such as heat waves and cold spells. Below are estimates of heat waves and cold spells for the Saint Lawrence Valley region, centred on Montreal. Here, as in Slonosky (2015), by definition a cold spell count starts with three consecutive days when the minimum temperature was less than -25ºC or the maximum temperature was less than -15ºC. If a fourth consecutive day fulfilled these criteria, the count incremented by one and so on. For heat waves, the conditions were maximum temperatures above 32ºC or minimum temperatures above 21ºC for three consecutive days, incremented as for cold spells.
It’s surprising to see the concentrated density of heat wave counts in the early 19th century; 1807 and 1808, as attested by Alexander Spark, and 1820, as attested by Thomas and John Samuel McCord and Alexander Skakel were years with both high average summer temperatures and repeated heat waves (Figure 6). The heat waves of 1807 and 1808 are reflected in European records (H. Bergström, pers comm), suggesting highly meridional flow with periods allowing southerly flow in both eastern Canada and western to central Europe as a potential cause. The heat waves seen in the Montreal records of 1820 are also reflected in those New England records (L.A. Dupigny-Giroux, pers. comm) which have data going back that far.
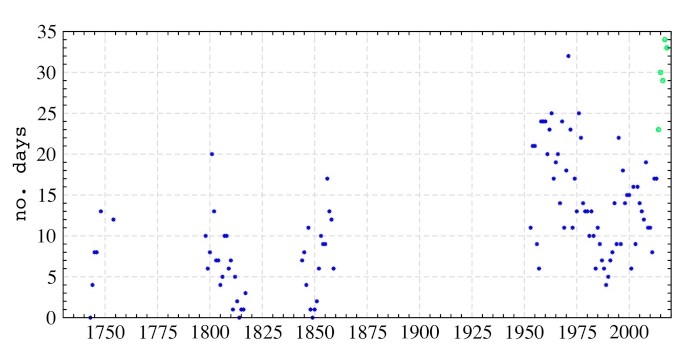
Finally, because many historical weather observers kept records of weather conditions as well as instrumental measurements, it’s also possible to get a sense of how much certain types of weather conditions have changed over the centuries. While frequencies of snowstorms or blowing snow are fairly comparable over time when observed by humans, the arrival of automatic weather stations or other recent changed in observing practices make some recent data incompatible with records kept for centuries (see Figure 7).
Canada has a wealth of historical weather documents, a scientific legacy that is only beginning to be unlocked. One of ACRE’s overall goals is to transcribe and make available for scientific analysis the estimated billion historical weather observations currently locked in paper archives. This data will then made used to further understanding of climate change, climatic variability, extreme events, weather hazards and their impacts. Canada has tens of millions of potential observations to contribute to this goal. McGill’s DRAW citizen science project is attempting to take this challenge online. DRAW is also being integrated into the classroom at the college (CEGEP) and plans are being made to integrate DRAW into high schools as well. If the DRAW project is successful in transcribing the McGill Observatory records, similar projects could be set up to transcribed historical data from across the country.
Analysis of the historical records has already revealed some surprises, such as the heat waves in the St Lawrence Valley during the early 19th century. Combined with the high number of cold spells, it suggests this was a time of increased climatic volatility. Scrutiny of descriptive weather conditions also highlights the importance of continuity in record keeping over time if we want to be able to compare historical and modern observations to evaluate climate change.
Acknowledgments
Many thanks are due to all the volunteers and citizen scientists, who have made it possible to analyze the historical weather data shown here, especially Gilles Paquette, Ray Couture, Pat Fortin, Rose Dlhopolsky, Carolyn Verduzco, Jennifer Dowker, Kristin Davoli, Alana Cameron, Kyle Hipwell, Dan Manweiler, Lisa Woodward, Nancy Hagen, Jason Ferguson, Jean-Paul Hacot, Federico Ponari, Hervé Hacot, Josée Lapointe and Louis Schwalm. Thanks to Xiaolan Wang for support from ECCC, and the DRAW team at McGill University: Renée Sieber, Rob Smith, Gordon Burr, Frederic Fabry, Drew Bush, Rachel Black, Sara Allan, Lori Podolsky, Eun Park, Yves Lapointe, Frederic Guiliano, Marissa Stimpson and all the DRAW students. Geoff Pearce and his students at Dawson College have also been dedicated DRAW contributors who are exploring the uses of historical weather data. Thanks to Cary Mock, Juerg Luterbacher, Rick Crouthamel and Mac Benoy for the use of their images, and to Lesley-Ann Dupigny-Giroux, Nancy Westcott, Hans Bergstrom, Ken Devine, Cynthia Wilson and the late Morley Thomas for sharing data and data sources.
About the Author
Victoria Slonosky studied climatology at McGill University and earned a PhD in historical climatology from the Climatic Research Unit in Norwich, UK and spent time in France on post-doctoral studies. On returning to Canada she investigated climatic change and variability in Canada from historical records dating back to the 1740s. She currently works with McGill University’s citizen science DRAW (Data Rescue: Archives and Weather) project to engage the public in rescuing Canada’s scientific heritage. Her book Climate in the Age of Empire: Weather Observers in Colonial Canada was recently published by the American Meteorological Society.
References
Allan, R., Brohan, P., Compo, G. P., Stone, R., Luterbacher, J., & Brönnimann, S. (2011). The International Atmospheric Circulation Reconstructions over the Earth (ACRE) Initiative. Bulletin of the American Meteorological Society, 92(11), 1421–1425. https://doi.org/10.1175/2011BAMS3218.1
Cram, T. A., Compo, G. P., Yin, X., Allan, R. J., Mccoll, C., Vose, S., … Worley, S. J. (2015). The International Surface Pressure Databank version 2. https://doi.org/10.1002/gdj3.25
Compo, G. P., Whitaker, J. S., Sardeshmukh, P., Matsui, N., Allan, R. J., Yin, X., … Worley, S. J. (2011).
The Twentieth Century Reanalysis Project (Vol. 137). https://doi.org/10.1002/qj.776
Slivinski, L. C., Compo, G. P., Whitaker, J. S., Sardeshmukh, P. D., Giese, B. S., McColl, C., … Wyszyn’ski, P. (2019). Towards a more reliable historical reanalysis: Improvements for version 3 of the Twentieth Century Reanalysis system. Quarterly Journal of the Royal Meteorological Society, qj.3598. https://doi.org/10.1002/qj.3598
Slonosky, V. C. (2015). Daily minimum and maximum temperature in the St-Lawrence Valley, Quebec: Two centuries of climatic observations from Canada. International Journal of Climatology, 35(7), 1662–1681. https://doi.org/10.1002/joc.4085
Slonosky Victoria C. (2019). Hazardous weather events in the St Lawrence Valley, from the French regime to Confederation: Examination of descriptive content in historical weather diaries from Quebec City and Montreal over the period 1742 to 1869. Natural Hazards. https://doi.org/10.1007/s11069-019-03612-5
Thorne, P. W., Allan, R. J., Ashcroft, L., Brohan, P., Dunn, R. J. H., Menne, M. J., … Worley, S. J. (2017). Toward an integrated set of surface meteorological observations for climate science and applications. Bulletin of the American Meteorological Society, 98(12). https://doi.org/10.1175/BAMS-D-16-0165.1
Plus comme ça :
Citizen Science, Data Rescue, DRAW, McGill Observatory, Victoria Slonosky