
Vancouver automne et hiver 2016/17 : Était-ce si mauvais ?
– par P. Odon, G. West, R. Stull; EOAS, Université de la Colombie-Britannique –
L’automne et l’hiver de 2016/2017 ont amené au sud-ouest de la Colombie-Britannique un climat inhabituellement froid et pluvieux. La côte sud a connu un automne anormalement pluvieux, surtout en termes de la fréquence de la pluie. Une série de tempêtes au début novembre a été ponctuée le 8 novembre 2016 par une catastrophe de rivière atmosphérique exceptionnellement chaude et humide. La tempête a provoqué des craintes d’inondation et a causé des maux de tête pour le personnel de la gestion des mesures d’urgence. Au cours de l’hiver, une série de cinq vagues arctiques ont entraîné des températures bien en dessous la normale, des accumulations de neige au-dessus de la normale, et un grand nombre de jours au cours desquels il y a eu une température minimale inférieure au niveau de congélation. Ceci a touché la population générale avec des conséquences coûteuses pour les secteurs gouvernemental et industriel. On traitera de l’évolution d’une de ces vagues en particulier. La combinaison de ces deux saisons a causé une période de six mois au cours desquels le climat de la côte sud de la Colombie-Britannique a été la pire de mémoire récente, et parmi les pires de son histoire.
Fall 2016 across BC’s South Coast
October saw significant snow accumulations at mid to high elevations, and record rainfall amounts in many low-elevation areas across the South Coast. Temperatures warmed to record levels ahead of an atmospheric river event on November 8th, 2016. Many daily records were set, with new monthly records of 19.4°C in Vancouver and 22.4°C in Abbotsford (see Fig. 8 for all mentioned locations). The combination of record warmth and rain-on-snow led to large snowmelt contributions to runoff, in addition to the heavy rainfall itself.
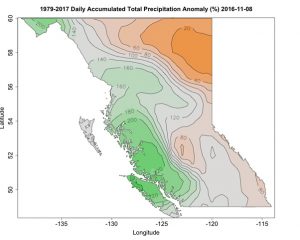
Figure 1 illustrates the fifteen-day precipitation anomalies for the first half of November. In several locations of the Coast it precipitated 200% more than normal.
For the province’s primary electric utility, BC Hydro, the situation made for challenging reservoir operations, balancing dam safety requirements with minimizing downstream flooding. Although most reservoirs across the South Coast were full or near full, the most concerning was the Campbell River system. The upper part of the watershed received the normal November monthly precipitation in the first eight days of the month [2]. Furthermore, one-week and two-week reservoir inflows set new records, and were estimated to exceed 1-in-100 year volumes.
In emergency coordination calls and meetings, BC Hydro worked with nearby towns, regional districts, and the province, deciding to increase discharges to a record-tying 600 m3s-1, enough to fill an olympic-sized swimming pool every four seconds. This was done to mitigate the risk of overtopping the dam in subsequent storms, which would’ve meant passing the full reservoir inflows (1100 m3s-1), flooding communities downstream [2].
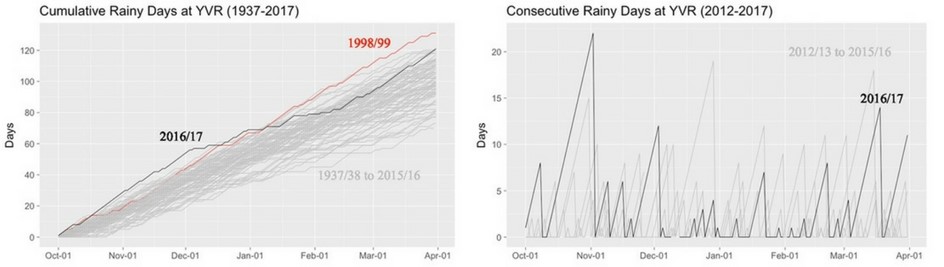
At Vancouver International Airport (hereafter, Vancouver) there were only three days without rain in October and only two in November (Fig. 2). In fact, the fall and winter 2016/17 period had the second highest frequency of rain since 1937/38, with 121 days of rain during the 182-day (6-month) period (Fig. 2). Only the 1998/99 period was higher, with 131 days of rain. Furthermore, this 2016/17 period featured 22 consecutive days of rain (October 12th – November 2nd; Fig. 3). This was the longest stretch in the past five years, and the ninth longest since 1937/38.
Winter 2016/17, Arctic Outbreaks
In December the pattern abruptly became much cold and drier. Five arctic air outbreaks brought anomalous cold temperatures, and snow to British Columbia in December through February.
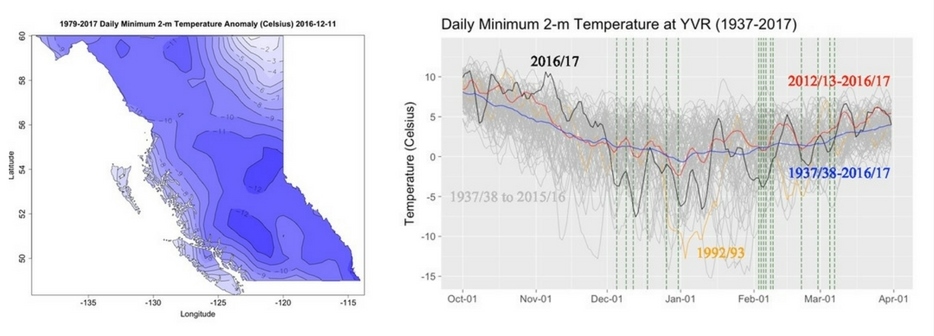
Figure 4 shows the 15-day average minimum 2-m temperature anomaly across British Columbia centered on second arctic outbreak on December 11th, 2016. It shows the difference between what British Columbians would expect for that time of year and what actually happened. Temperatures were much colder than average, with much of BC more than 10°C below normal.
In Vancouver, daily minimum temperatures were below freezing for most of December, January and the first part of February. This period was colder than winters in recent memory (5-year average, red line in Fig. 5) and the long term average (80-year average, blue line in Fig. 5). There were 54 days of below freezing daily minimum temperature during the entire 6-month period, more than any such period since 1992/93 (orange line in Fig. 5).
The five arctic outbreaks can be identified in the smoothed minimum temperature time series by the large departures from the 80-year average, occurring on approximately December 5th and 11th, 2016, January 1st and 10th, 2017 and February 2nd, 2017; most followed by snow days (Fig. 5).
These weather events directly impacted the general population as well as government and industry. Garbage was left uncollected for weeks in neighbourhoods of Vancouver, Burnaby, Surrey and Delta [3,4] due to persistent snow and ice cover in alleys and lanes.
Across Metro Vancouver, many side streets and sidewalks were left uncleared and unsalted. Residents had difficulties simply getting around the city and questioned the Vancouver Mayor’s commitment to the issues [5]. Nearby cities also experienced salt shortages, rationing their supplies. Stores and wholesalers were also having trouble meeting the demand [6].
By the end of December, the city of Vancouver had spent $2.5 million on snow and ice reduction, triple the amount used in the previous two winter periods combined [6]. Even after the unusual cold winter, Vancouver still needed to address the nearly 15,000 potholes (almost double than normal) affecting drivers [7].
Long waits, cancellations and delays also left commuters questioning Vancouver’s public transportation system readiness for such cold winter weather [8] (Fig. 6a). Additionally, strong arctic outflow winds over the Salish Sea during the outbreaks led B.C. Ferries to cancel sailings, impacting ferry commuters [9].
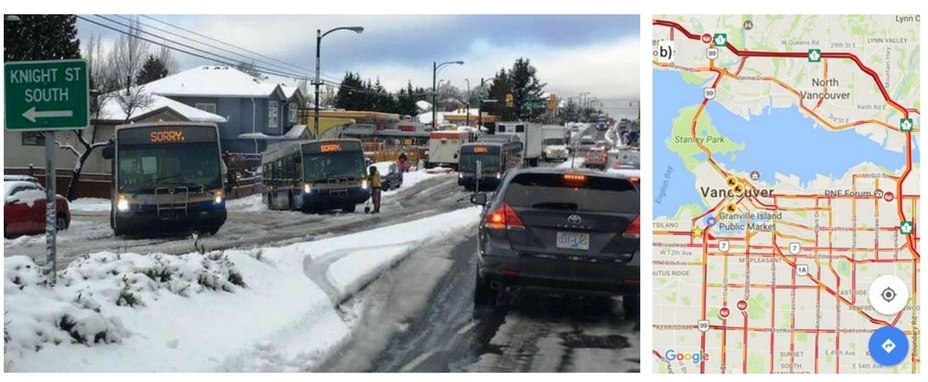
During the arctic outbreaks, approximately $5 million was spent to operate an ice-clearing cable collar system on the Port Mann Bridge — the province’s primary east-west corridor for both commercial and commuter traffic. By contrast, just $300,000 was spent to operate it in 2015/16. Lane closure due to crews clearing the bridge and Highway 1 led to major traffic problems during the last arctic outbreak on February 3rd, 2017 [10] (Fig. 6b).
During the third arctic outbreak on January 3rd, 2017, BC Hydro set a new record for power consumption, breaking the old record set on Nov 29th, 2006 [12]. Finally, in the last outbreak in early February, a storm cycle brought record-breaking snow and freezing rain to the Fraser Valley. Abbotsford observed 57.8 cm of snow [13] and there were reports of up to 80 cm in Chilliwack [14]. Freezing rain accumulated 2-4 cm [15]. 361,000 BC Hydro customers lost power [16] and Vancouver was cut off from the rest of BC with highways 1, 3, 5 and 99 all closed [17]. The large-scale features providing the atmospheric context of these intense arctic outbreaks will be described next.

Anatomy of an Arctic Outbreak
The five arctic outbreak events were each comprised of a cold continental airmass associated with a strong arctic high pressure system in Alaska and the Yukon, combined with a warmer, moist air mass associated with a Pacific low pressure system. The lows played an important role in producing periods of snow across the South Coast.
In far northern latitudes, during winter the sun angle is low or below the horizon. This means incoming solar radiation is very limited, while outgoing radiation from the earth’s surface continues unabated. This creates a negative surface energy budget and the air cools, building very cold airmasses at the surface. Such airmasses are associated with strong high pressure like that seen over Alaska and the Yukon during the first outbreak between December 4th, 2016 and December 6th, 2016 (blue shading in Fig. 7a, and red sea level pressure contours in Fig. 7b).
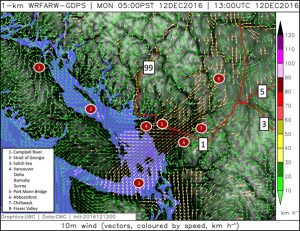
The cold, dense, stable airmass flows through valleys, fjords, and straits on its way to Vancouver, partially blocked by the higher mountainous terrain of British Columbia (Figs. 7c and d). Where the valleys, fjords and straits widen, the cold air spreads and thins, accelerating into arctic outflow winds [18]. An example is shown in a fine-resolution computer model forecast for the second arctic outbreak on December 12th (Fig. 8). These outflow winds have impacts of their own, like the cancelled B.C. Ferries sailings in the Strait of Georgia mentioned in the previous section.
Often an arctic outbreak event will draw to a close with the approach of a Pacific low pressure system ushering in moist, mild air. In the December 5th outbreak, an upper level low over the Gulf of Alaska moved southward down the coast (Figs. 7a and c). With low-level arctic air in place, the upper-level trough and associated surface low pressure brought 5-15 cm of snow across the South Coast, with 5.4 cm measured in Vancouver (Figs. 7c and d). While this is relatively little snow compared to snowfalls in other parts of Canada, it caused major disruptions.
Summary – Vancouver winter 2016/17, how bad was it?
We’ve presented an overview of the weather and impacts of the fall/winter 2016/17 seasons at BC’s South Coast. The fall season was abnormally wet for multiple months, especially in terms of frequency of precipitation. This culminated in an early November storm cycle that caused headaches for emergency management personnel, and featured greater than 1-in-100-year cumulative flows for parts of Vancouver Island. Subsequently we discuss the anatomy of an arctic air outbreak, and showed that a series of five such outbreaks led to a well-below-normal winter, and an abnormally large number of days with below-freezing minimum temperatures. The result was a 6-month period of weather that, by the metrics discussed herein, was the worst in recent memory, and among the worst in history for the South Coast of BC.
References
[1] Dee, D. P., Uppala, S. M., Simmons, A. J., Berrisford, P., Poli, P., Kobayashi, S., Andrae, U., Balmaseda, M. A., Balsamo, G., Bauer, P., Bechtold, P., Beljaars, A. C. M., van de Berg, L., Bidlot, J., Bormann, N., Delsol, C., Dragani, R., Fuentes, M., Geer, A. J., Haimberger, L., Healy, S. B., Hersbach, H., Hólm, E. V., Isaksen, L., Kållberg, P., Köhler, M., Matricardi, M., McNally, A. P., Monge-Sanz, B. M., Morcrette, J.-J., Park, B.-K., Peubey, C., de Rosnay, P., Tavolato, C., Thépaut, J.-N. and Vitart, F. (2011), The ERA-Interim reanalysis: configuration and performance of the data assimilation system. Q.J.R. Meteorol. Soc., 137: 553–597. doi:10.1002/qj.828
[2] BC Hydro (Nov 18, 2016). Record inflows, but limited downstream flooding, thanks to BC Hydro operations and some luck. Retrieved from https://www.bchydro.com/news/
[3] Correia, C. (Dec 28, 2016). Winter conditions testing patience of Lower Mainland residents. Retrieved from http://www.cbc.ca/news/canada/british-columbia
[4] McElroy, J. (Dec 15, 2016). Extended cold snap putting a strain on services throughout Metro Vancouver. Retrieved from http://www.cbc.ca/news/canada/
[5] Laanela, M. (Jan 05, 2017). Vancouver mayor absent as councillor calls for snow removal inquiry. Retrieved from http://www.cbc.ca/news/canada/british-columbia
[6] City of Vancouver (Jan 04, 2017). City crews continue work to remove remaining snow and ice. Retrieved from http://vancouver.ca/news-calendar/news.aspx
[7] CTV Vancouver (Mar 30, 2017). Wicked winter leaves behind 15,000 potholes in Vancouver. Retrieved from http://bc.ctvnews.ca/
[8] McElroy, J. (Jan 06, 2017). Vancouver in its longest cold snap in over 30 years. Retrieved from http://www.cbc.ca/news/canada/british-columbia
[9] Brend, Y. (Dec 04, 2016). BC Ferries cancels sailing due to ‘severe weather’ as winter chill hits. Retrieved from http://www.cbc.ca/news/canada/british-columbia
[10] Saltman, J. (April 3, 2017). BY THE NUMBERS: Winter’s costly impact on Alex Fraser and Port Mann bridges. Retrieved from http://vancouversun.com/news/
[11] Fritz, W. Y. (Dec 20, 2016). Winter is no reason to mind your manners in @WinnieYeo [Twitter]. Retrieved from https://twitter.com/winnieyeo?lang=en.
[12] Paetkau, J. (Jan 04, 2017). Record breaking power usage as cold snap continues. Retrieved from http://www.cbc.ca/news/canada/british-columbia
[13] Environment and Climate Change Canada. Historical Climate Data. Retrieved from climate.weather.gc.ca
[14] Macmahon, M. (Feb 06, 2017). Fraser Valley hit hardest by snowfall, more on the way. Retrieved from http://www.news1130.com/
[15] Meuse, M. (Feb 09, 2017). Fraser Valley weather the worst veteran CBC cameraman has ever seen. Retrieved from http://www.cbc.ca/news/canada/british-columbia
[16] Luymes, G. (Feb 11, 2017). Winter storm blows over in time for Family Day. Retrieved from http://vancouversun.com/category/news/local-news
[17] McElroy, J. (Feb 10, 2017). Weather closes every highway linking Lower Mainland to rest of B.C.. Retrieved from http://www.cbc.ca/news/canada/british-columbia
[18] Jackson, Peter L. (1996), Surface winds during an intense outbreak of arctic air in Southwestern British Columbia. Atmosphere-Ocean, 34:2, 285-311. doi: 10.1080/07055900.1996.9649566
About the Author: Pedro Odon
Pedro is a PhD Candidate in Atmospheric Sciences with the Department of Earth, Ocean and Atmospheric Sciences at UBC. He is developing a website for BC Hydro to forecast extreme weather events taking into account climate change. Previously, he was a school teacher in Mathematics in Brazil, Argentina and the United States.