
Prévisions saisonnières de l’hiver arctique 2020-2021: Température et Précipitations
– Par des contribueurs de l’Environnement et Changement climatique Canada, l’Université du Québec à Montréal, l’Institut de l’Arctique et de l’Antarctique, l’Institut météorologique norvégien, l’Institut météorologique finlandais, l’Organisation météorologique mondiale, , le Centre de prévision du climat de l’Agence américaine d’observation océanique et atmosphérique, et le Centre de recherche international de l’arctique. –
.
Déclaration de consensus du Forum sur le climat de l’Arctique (suite)
FAITS SAILLANTS
La combinaison d’une circulation atmosphérique méridienne de l’Arctique (nord-sud) et du réchauffement de la surface de l’océan cet été (JJA : juin, juillet, août 2020) est le principal facteur à l’origine des anomalies de température, de précipitations et de glace de mer de la saison passée. Les températures supérieures à la normale prévues pour toutes les régions arctiques cet hiver (de novembre 2020 à janvier 2021) continueront d’avoir des répercussions sur la glace de mer pendant cette période.
Température : Les températures moyennes de l’air en surface lors de l’été 2020 ont été supérieures à la normale dans la plupart des régions arctiques, des records de températures ayant notamment été battus en Sibérie orientale. On s’attend à ce que les températures continuent d’être supérieures à la normale dans la majorité de l’Arctique cet hiver.
Précipitations : Une forte variabilité spatiale entre des conditions plus humides et des conditions plus sèches que la moyenne a été observée à travers l’Arctique en JJA 2020. On s’attend à des conditions plus humides que la normale dans la majorité de l’Arctique cet hiver.
2020-2021 Arctic Winter Seasonal Climate Outlook for Temperature and Precipitation
– By contributors from Environment and Climate Change Canada, Arctic and Antarctic Research Institute (Russia), Hydrometeorological Centre of Russia, the Norwegian Meteorological Institute, the Finnish Meteorological Institute, World Meteorological Organization, Climate Prediction Center, National Oceanic and Atmospheric Administration (USA), National Oceanic and Atmospheric Administration, International Arctic Research Center (IARC, USA) –
Arctic Climate Forum Consensus Statement (Continued)
HIGHLIGHTS
The combination of an Arctic meridional atmospheric circulation (north-south) and high ocean surface heating this summer (JJA: June, July, August 2020) was the main driver of this past season’s temperature, precipitation and sea ice anomalies. Above normal temperatures forecast for all Arctic regions, this winter (November 2020 to January 2021) will continue to have implications for sea-ice over that time period.
Temperature: The summer 2020 average surface air temperatures were above normal for most of the Arctic domain, with Eastern Siberia observing record-breaking temperatures. Above normal temperatures are expected to continue across the majority of the Arctic this winter.
Precipitation: High spatial variability between wetter and drier than average conditions was observed across the Arctic during JJA 2020. Wetter than normal conditions are expected across the majority of the Arctic region this winter.
UNDERSTANDING THE CONSENSUS STATEMENT
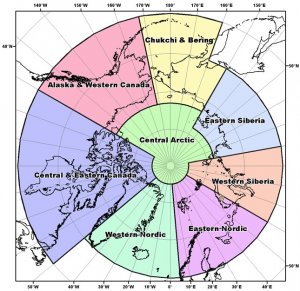
This consensus statement includes: a seasonal summary and forecast verification for temperature and precipitation for previous 2020 Arctic summer season (June, July, and August 2020); an outlook for the upcoming 2020-2021 Arctic winter season (November 2020, December 2020, and January 2021). Figure 1 shows the regions that capture the different geographic features and environmental factors influencing temperature/precipitation.
The temperature and precipitation forecasts are based on eleven WMO Global Producing Centers of Long-Range Forecasts (GPCs-LRF) models and consolidated by the WMO Lead Centre for Long Range Forecast Multi-Model Ensemble (LC-LRFMME). In terms of models’ skill (i.e. the ability of the climate model to simulate the observed seasonal climate), a multi-model ensemble (MME) approach essentially overlays all of the individual model performances. This provides a forecast with higher confidence in the regions where different model outputs/results are consistent, versus a low confidence forecast in the regions where the models don’t agree. The MME approach is a methodology well-recognized to be providing the most reliable objective forecasts.
TEMPERATURE
Summary for June, July, and August 2020:
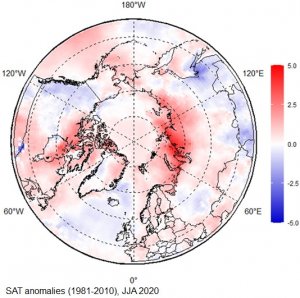
The June, July, and August (JJA) 2020 average surface air temperatures in the Arctic north of 65°N was above normal over most of the region, including Western and Eastern Siberia, the Chukchi and Bering region, and the central part of the Canadian Arctic (red areas in Figure 2). A persistent high atmospheric pressure over the Central Arctic and Eastern Siberia regions through the summer, combined with low atmospheric pressure over the Alaska and Western Canada region (ERA5, not shown here), led to several heat waves in Eastern Siberia in June and July 2020 and record high temperatures in Eastern Siberia (+38 °C at Verkhoyansk on 20 June). In turn, this atmospheric pattern resulted in slightly below normal surface air temperatures over Western Canada and a portion of the Norwegian Sea (light blue areas in Figure 2).
The JJA 2020 temperature forecast was verified by subjective comparison between the forecast (Figure 3, left) and re-analysis (Figure 3, right), region by region. A re-analysis is produced using dynamical and statistical techniques to fill gaps when meteorological observation are not available.
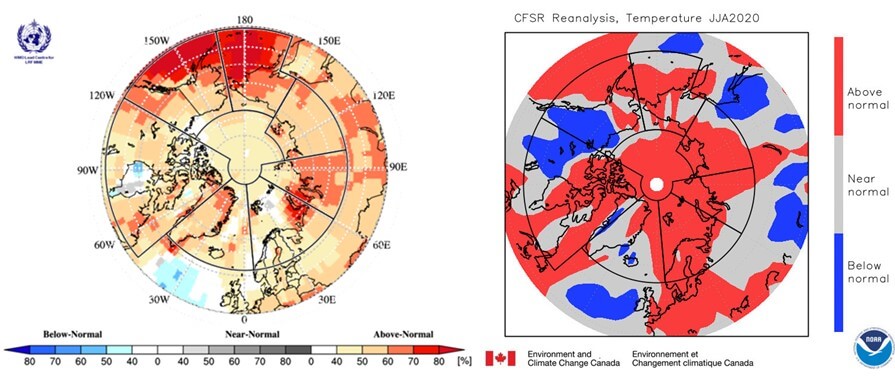
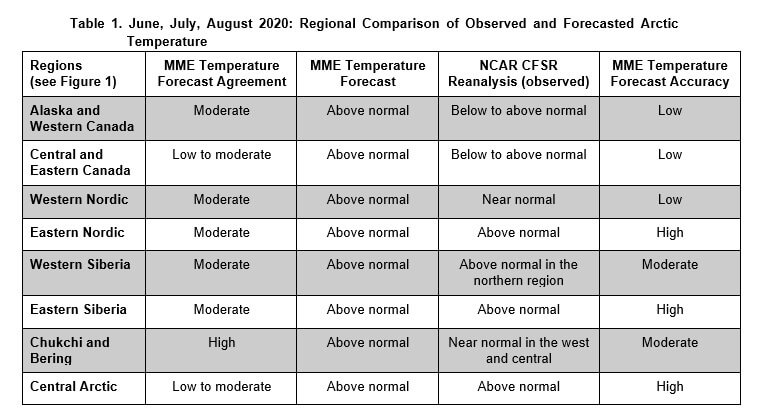
Above-normal surface air temperatures over the Eastern Nordic and Eastern Siberia regions were accurately forecast for the JJA 2020 season (Figure 3, Table 1). The forecast accuracies were moderate over the Western Siberia and Chukchi and Bering regions, but the observed above-normal temperatures over the northern part of Western Siberia were accurately forecasted. On the other hand, the observed below to near-normal temperatures over Alaska, Canada, and the Western Nordic regions (grey areas on Figure 3, right) were not accurately forecasted. As a general conclusion, the multi-model ensemble forecast was accurate for approximately 60% of the Arctic territory.
Outlook for winter 2020-2021:
Surface air temperatures during winter 2020 (NDJ: November 2020, December 2020, and January 2021) are forecast to be above normal across the majority of the Arctic regions (yellow, orange and red areas in Figure 4). The confidence of the forecast is low to moderate over Alaska, Canada, Eastern Siberia, and the Chukchi and Bering regions (yellow and orange areas in Figure 4, Table 2), and high over the Eastern Nordic, Western Siberia, and Central Arctic regions (dark red areas in Figure 4, Table 2). The multi-model ensemble did not agree over central Alaska and most of Greenland (white areas in Figure 4).

PRECIPITATION
Summary for June, July, and August 2020:
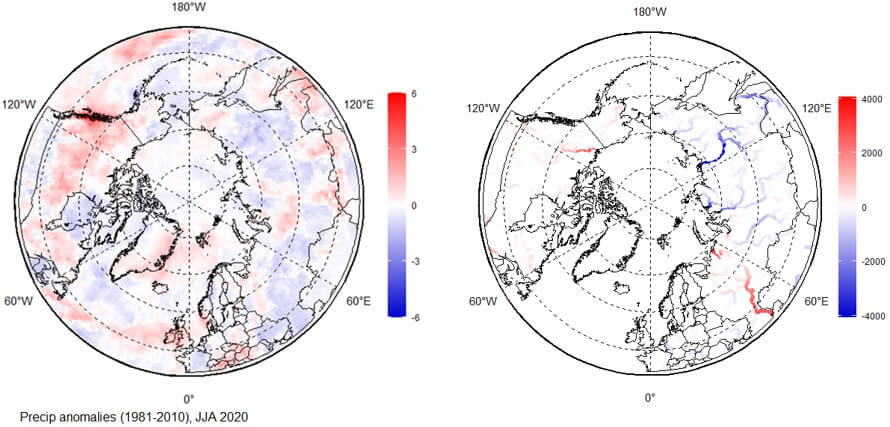
Wetter than average conditions were observed during June, July, and August 2020 (JJA) 2020 over the Western Nordic, and Alaska and Western Canada regions (red areas in Figure 5, left). On the other hand, the majority of the Eastern and Western Siberia regions, along with the Chukchi and Hudson Bay area, experienced drier than average conditions (blue areas in Figure 5, left). The impacts of wetter/drier regions were reflected in the JJA 2020 Arctic rivers discharge: lesser drainage than normal is seen in Ob’, Enisey and Lena rivers, and further eastward (blue areas in Figure 5, right), while the Mackenzie and Yukon rivers experienced greater discharge than normal over that same time period (red areas in Figure 5, right). The snow extent in May-September 2020 was lower than normal, with extreme negative anomalies (no snow) observed in most of Siberia and Alaska (Rutgers Glob SnowLab-https://climate.rutgers.edu/snowcover/). Positive anomalies (more snow) were observed in May in parts of Scandinavia, Eastern Canada, and in September in Northern Canada (not shown here).
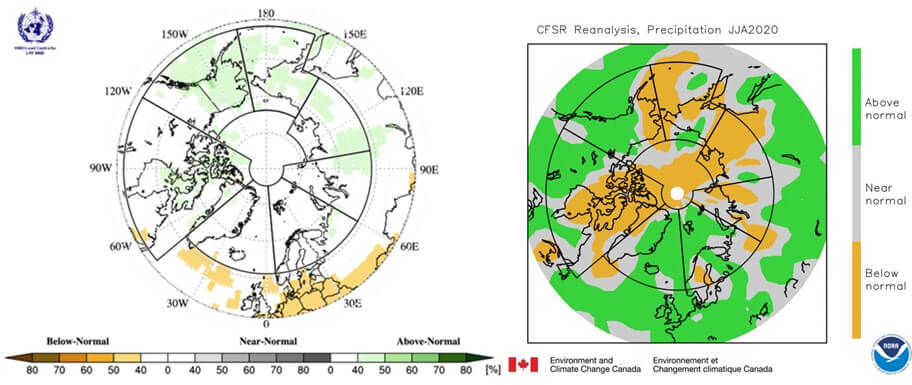
The JJA 2020 precipitation forecast was verified by subjective comparison between the forecast (Figure 6, left) and re-analysis (Figure 6, right), region by region. As for temperature, precipitation re-analysis is produced using statistical techniques to fill gaps when meteorological observations are not available.
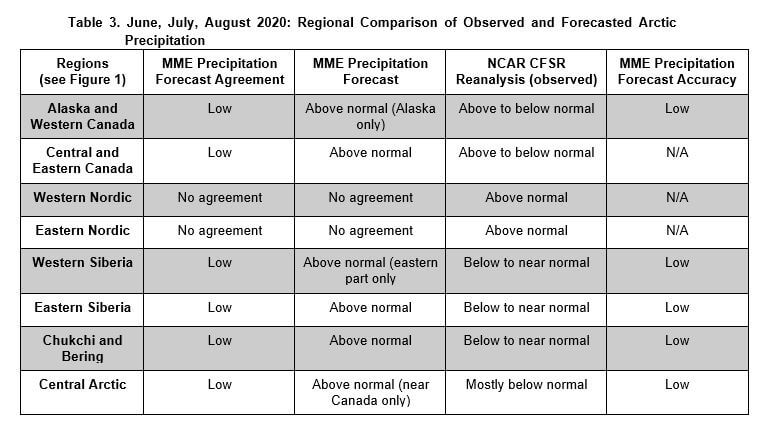
Overall, the accuracy of the JJA 2020 precipitation forecast was low. Indeed, the observed below to near-normal precipitation over the majority of the Arctic was not accurately forecast for the JJA 2020 season (Figure 6, Table 3). In addition, there was no agreement amongst the models over the Western Nordic, Eastern Nordic, and the majority of the Western Siberia regions (predominance of white areas over those regions). As a general conclusion, the multi-model ensemble forecast was not accurate for JJA 2020.
Outlook for winter 2020-2021:
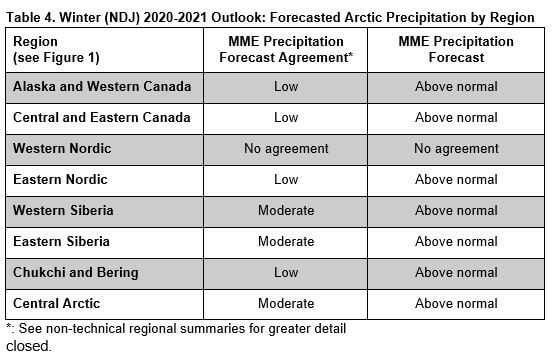
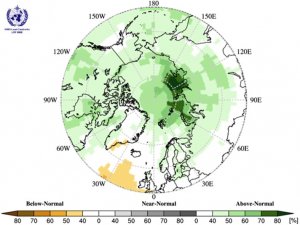
Precipitation during winter 2020-2021 (NDJ: November 2020, December 2020, and January 2021) is forecast to be above normal over the majority of the Arctic region. Forecast confidence is primarily low (light green areas in Figure 7, Table 4), with the exception of the northern parts of the Western and Eastern Siberia regions, and parts of the Central Arctic region, where forecast confidence is moderate (dark green areas in Figure 7, Table 4). The multi-model ensemble did not agree over the majority of the Western Nordic region (white areas in Figure 7).
Background and Contributors
This Arctic seasonal climate outlook was prepared for ACF-6. Contents and graphics were prepared in partnership with the Russian, United States, Canadian, Norwegian, Danish, Finnish, Swedish, and Icelandic meteorological agencies and contributions of the former JCOMM Expert Team on Sea-ice, former CCl/CBS Inter-Programme Expert Team on Regional Climate Activities, the GCW, the IICWG, and with input from AMAP.
The ArcRCC-Network, a collaborative arrangement with formal participation by all the eight Arctic Council member countries, is in demonstration phase to seek designation as a WMO RCC-Network, and its products and services are in development and are experimental. For more information, please visit https://arctic-rcc.org/acf-fall-2020
List of authors:
Gabrielle Gascon, Katherine Wilson, Marko Markovic (corresponding author), Scott Weese and Bill Appleby (Environment and Climate Change Canada, Canada)
Vasily Smolyanitsky (Arctic and Antarctic Research Institute, Russia)
Valentina Khan (Hydrometeorological Centre of Russia, Russia)
Helge Tangen, Eivind Stoylen and Lene Ostvand (The Norwegian Meteorological Institute, Norway)
Johanna Ekman (Finnish Meteorological Institute, Finland)
Anahit Hovsepyan, Rupa Kumar Kolli (WMO)
Arun Kumar, Shanna Combley (Climate Prediction Center, National Oceanic and Atmospheric Administration, USA), Renee Tatusko (NOAA, USA), Rick Thoman, International Arctic Research
Center (IARC, USA)
Acronyms:
ArcRCC-Network: Arctic Regional Climate Centre Network https://www.arctic-rcc.org/
ACF: Arctic Climate Forum
AMAP: Arctic Monitoring and Assessment Programme
CCl: WMO Commission for Clilmatology/
CBS: WMO Comission for Basic Systems
GCW: Global Cryosphere Watch
GPCs-LRF: WMO Global Producing Centres Long-Range Forecasts
IICWG: International Ice Charting Working Group
IOC: Intergovernmental Oceanographic Commission
JCOMM: Joint WMO/IOC Technical Commission on Oceanography and Marine Meteorology
LC-LRFMME: WMO Lead Centre for Long Range Forecast Multi-Model Ensemble
NCAR: National Center for Atmospheric Research
NCAR CFSR: National Center for Atmospheric Research Climate Forecast System Reanalysis
NOAA/NWS/NCEP/CPC: National Oceanic and Atmospheric Administration/National Weather Service/National Centers for Environmental Prediction/Climate Prediction Center (United States of America)
MME: Multi-model ensemble
RCC: WMO Regional Climate Centre
RCOF: Regional Climate Outlook Forum
WMO: World Meteorological Organization
Déclaration de consensus du Forum sur le climat de l’Arctique, le Forum sur le climat de l’Arctique, Précipitation de l'Arctique, Remove term: Institut de l'Arctique et de l'Antarctique Institut de l'Arctique et de l'Antarctique, température de l'Arctique