
Note concernant les prévisions de chutes de neige du radar d’ECCC et les données radar
Par Diar Hassan (Wood PLC, Ottawa ON), George Isaac (Weather Impacts Consulting Inc., Barrie ON), Peter Taylor (York University, Toronto ON), Daniel Michelson (Environnement et Changement climatique Canada – ECCC), et Norman Donaldson (ECCC).
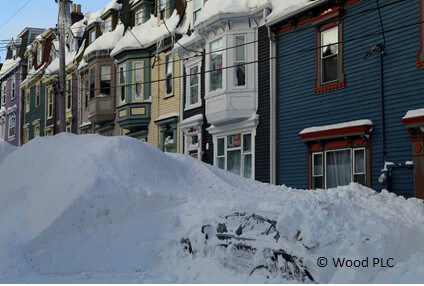
C’est un fait qu’il neige souvent à Terre-Neuve-et-Labrador, mais le 17 janvier 2020, la situation a été un peu extrême (figure 1). Les rapports METAR de l’aéroport de St John’s, CYYT, révélaient une chute de neige de 35 cm entre 1200 et 1800 UTC et une accumulation additionnelle de 19 cm dans les six heures suivantes. Ces mesures de l’épaisseur de neige concordent avec de nombreuses autres dans la région.
Les images radar d’ECCC montrent les taux d’accumulation de neige à l’état solide en cm h-1 pendant l’hiver, en se basant sur l’hypothèse que le ratio de neige à l’état solide/neige à l’état liquide est de 10:1, de sorte que 1 mm h-1 d’équivalent en eau de la neige (EEN) correspond à 1 cm h-1 de neige à l’état solide. Les valeurs de réflectivité (dBZ) affichées sur les images radar d’ECCC (voir la figure 2) sont (Ze+6,5 dBZ), ci-après appelées Zes.
Les services météorologiques partout dans le monde (p. ex. NWS) utilisent et signalent les Zes depuis leurs radars, peu importe le type de précipitation. Néanmoins, en hiver, sur les sites radars publics d’ECCC, la réflectivité représentée, ci-après Zes, correspond à Ze + 6,5 dBZ après avoir présumé que la rétrodiffusion de flocons de neige est équivalente à celle de boules de glace présentant la même masse.
MétéoCAN, la populaire application mobile, fusionne les données radar américaines et canadiennes, mais bon nombre de membres du public canadien ont accès aux données radar d’ECCC au moyen du radar et de sites Web publics historiques. Ces services sont très utiles, mais de nombreuses personnes ayant un intérêt plus marqué pour la météo, ou des préoccupations à cet égard, apprécieraient avoir plus d’images (Doppler et polarisation double) et un accès facilité aux valeurs réparties sur une grille des variables radar et d’autres données numériques (p. ex. PNT). Les données canadiennes sont aussi utilisées par des fournisseurs de données radar américaines et canadiennes combinées, notamment MétéoMédia et la Weather Underground Organization. Ces fournisseurs paient ECCC pour la communication de données numériques en temps réel.
Malgré l’excellente disponibilité de EUMETNET OPERA, l’accès d’images composites de réflectivité aux données sur les produits sous-jacentes et aux ensembles de données d’origine sur le balayage polaire et le volume, exposé par Huuskonen et coll. (2014), continue d’être difficile en raison de différentes procédures et solutions techniques selon les données et le type d’utilisateur.
L’Australian Bureau of Meteorology propose une solution intéressante consistant à transmettre les données à un service FTP et à imputer un droit de recouvrement des coûts pour y avoir accès. Les utilisateurs autorisés extraient ensuite les données de ce service. Les données sont accessibles gratuitement sur un réseau d’établissements partagé par les universités. Ces solutions sont préférables pour transmettre activement les données à des clients individuels.
Résumé
• ECCC devrait désormais afficher un facteur de réflectivité radar équivalent (Ze) au lieu de Zes.
• ECCC devrait encourager les études sur les chutes de neige par radar à l’interne ainsi que dans le secteur universitaire et privé afin d’améliorer les prévisions de précipitations du radar vu ses nombreuses applications.
• ECCC devrait fournir un accès public à plus d’images (Doppler et polarisation double, aussi bien les images actuelles qu’archivées) et un accès raisonnable aux paramètres complets du radar de balayage pour les universités, d’autres chercheurs et des entreprises privées. La nécessité d’avoir des métadonnées, notamment des documents d’étalonnage, est aussi cernée.
It often snows in Newfoundland but on 17 January 2020, it was a little extreme (Figure 1). METAR reports from St John’s airport, CYYT, indicated 35 cm of snow fell between 1200-1800 UTC and another 19 cm in the next 6 hours. These snowfall depth measurements are consistent with many others in the area.
Reflectivity (Z), Equivalent Reflectivity (Ze), and Snowfall Rate Equivalent Reflectivity (Zes)
ECCC radar images display the solid snowfall rates in cm h-1 during the winter season, based on the assumption that the solid snow to liquid ratio is 10:1, so that 1 mm h-1 of snow water equivalent (SWE) corresponds to 1 cm h-1 of solid snow. The reflectivity values (dBZ) being displayed on the ECCC radar images (in Figure 2) are (Ze+6.5 dBZ) and will hereafter be called Zes.
The radar reflectivity factor, Z, is “the sum of the sixth-powers of the diameters of the water drops in a unit volume of space, or the melted diameters of the snow and ice particles in a unit volume”. It is normally expressed in units of mm6m-3. It has a very wide range of values and its decibel value is dBZ = 10 log10(Z/1.0 mm6m-3). Z is determined by the, generally unknown but assumed, size distribution of the precipitation. The strength of the backscattered radar signal depends on several factors such as radar parameters, physical constants, and path considerations but also on |K|2Z, where |K|2 is the dielectric constant of the hydrometeors causing the backscatter (see Fabry, 2015 for details). Even with rain, there are complications depending on the size and shape of the raindrops (e.g. are they Rayleigh scatterers). The |K|2 factor is different between liquid water (|Kw|2 = 0.93) and ice (|Ki|2 = 0.176), and snowflakes are not simple spheres of ice. In processing radar backscattered power, the standard procedure is to calculate the value of |K|2Z that would give that power, assuming properties of the radar beam are correctly known. If dealing with rain, we can use K = Kw and get a good estimate of Z, but for snow and other forms of mixed precipitation, there is uncertainty about K. In practice, the liquid water value, Kw, is used and a corresponding, Ze, value is referred to as the “equivalent reflectivity factor”. For snow, Ze is significantly smaller than the true Z because of the ratio of (|Ki|2/|Kw|2) but the ice/water density difference is also a factor since Z is defined in terms of melted diameters.
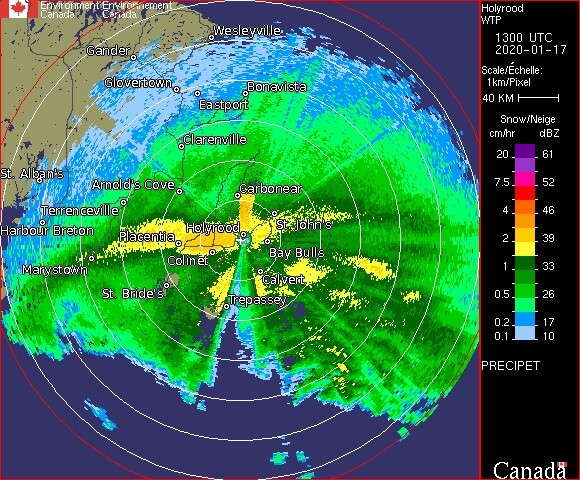
Weather services around the world (e.g. NWS) use and report Ze from their radars, regardless of the precipitation type. On ECCC’s public radar sites, however, in winter the displayed reflectivity, denoted hereafter as Zes, is equivalent to Ze + 6.5 dBZ after assuming that the snowflake backscatter is equivalent to that of ice spheres of the same mass. Figure 2 depicts an example of the ECCC public radar displaying Zes. This can be based on the Smith (1984) analysis leading to Zes = Ze/0.224 or in decibels Zes = Ze + 6.5 dB. The use of Zes appears to be unique to ECCC and, as we see it, is a potential cause of confusion. It would be better to just use Ze.
Snowfall Rates
For snowfall, ECCC use a relationship based on the melted diameter distributions from Gunn and Marshall (1958) and Sekhon and Srivastava (1970); Z = Zes = 1780 R2.23 and R= 0.0338 Zes0.4525, where R is the SWE precipitation rate in mm h-1. Hassan et al. (2017) compared sets of measured SWE during solid snowfall events in the Toronto and St John’s areas to establish alternative R(Zes) relationships. Their overall best fit is R= 0.0295 Zes0.618, based on precipitation rates computed from 10 min radar reflectivity values, Zes, provided by ECCC (raw radar data), added and compared to in-situ hourly (and sometimes other) SWE measurements. Although there is considerable scatter in the data, seen in Figure 3, the relationship indicates much higher snowfall rates than the Sekhon-Srivastava (S&S) relationship employed by ECCC. This can also be seen in Figure 4, where the current ECCC relationship is severely underestimating snowfall rates. The Finnish Meteorological Institute (FMI) equation is also shown (converted here from Ze to use Zes) in addition to the Huang et al. (2010) equation. Several relationships based on subsets (Oakville, Mt Pearl, etc.) of the Hassan et al. (2017) data are also shown in this figure.
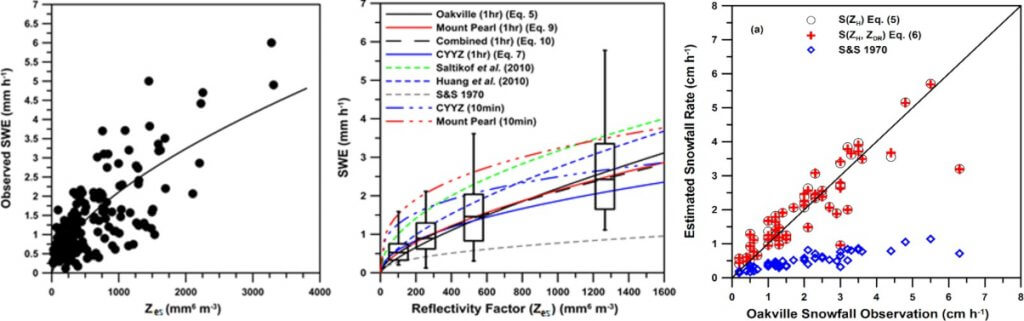
(Centre) Figure 4. Snow water equivalent (SWE) estimation versus reflectivity factor (Zes) using 1 h interval data, the combined dataset, 10 min interval data, Saltikoff et al. (2010), Huang et al. (2010) and the Sekhon and Srivastava (1970) algorithms. The box plots represent 25, 50 and 75% of the observed data while the whiskers represent the extremes. From Hassan et al. (2017).
(Right) Figure 5. Estimated snowfall rate (cm h-1, from Hassan et al. (2018) relationships, S(ZHes) and S(ZHes,ZDR) and from the ECCC operational algorithm based on Sekhon and Srivastava (1970) versus observed snowfall rates at Oakville, ON for Jan-Mar 2011, Jan-Feb, 2012, Dec 2012 and Jan-Feb 2013.
Snow depth measurements and snow-to-liquid equivalent ratio (SLR) measurements are less generally available nowadays due to the conversion of most of the manned reporting stations to use automated weather observing systems (AWOS). However, Hassan et al. (2018) collected data, manually, in Oakville, over 2 winter seasons, and derived the S(Zes) relationship, S(cm h-1) = 0.057 Zes0.59, referred to as Eq. (5) in Figure 5. This figure includes a comparison of that relationship versus the observations, together with the S&S estimations using SLR = 10, and also Eq. (6) from Hassan et al. (2018), derived from dual-polarization data. Further studies along these lines would be useful and if solid snowfall rate (S cm h-1) is required then a direct S(Ze) relationship rather than from SWE(Zes) and SLR would be desirable.
Radar estimation of solid snowfall rates is of great importance to meteorologists and winter maintenance crews as they both rely on such parameters when issuing warnings and mobilizing snow removal or treatment crews to affected areas. The application can also be extended to hydrological applications and Z(S) relationships for radar data assimilation into numerical weather prediction (NWP) models.
Data Availability
The popular smartphone application, WeatherCAN, merges US and Canadian radar data, but many members of the Canadian public access ECCC radar data as imagery through the radar and historical public web sites. These services are very useful, but for many with a deeper interest or concerns about the weather, it would be appreciated to have more imagery (Doppler and dual-polarization) and easy access to gridded values of radar variables and other numerical data (e.g. NWP). Canadian data are also used by providers of blended US and Canadian radar data including the Weather Network and the Weather Underground. Those suppliers pay ECCC for delivery of real-time numerical data.
In contrast, many, if not all, of such products and data are freely available from the US National Weather Service radars (NEXRAD). For example, Doppler images (Velocity) and archived (up to the previous day’s data) images and digital information are accessible to the public.
While European countries are making their radar data increasingly openly available, there remains a well-positioned economic interest group in ECOMET that coordinates most countries’ mandated cost-recovery policies regarding data and products. Despite excellent availability of EUMETNET OPERA reflectivity composite imagery access to the underlying product data and original polar scan and volume data sets, outlined in Huuskonen et al. (2014), continues to be challenging with different procedures and technical solutions depending on data and user type.
The Australian Bureau of Meteorology has an interesting solution, where they push data to an FTP service and charge a cost-recovery fee for access to it. Authorized users then pull data from this service. Data is also freely available on an academic network shared by universities. These solutions are preferable to actively pushing data to individual clients.
Summary
- ECCC should switch to display equivalent radar reflectivity factor (Ze) rather than Zes.
- ECCC should encourage radar snowfall studies, internally as well as in academia and the private sector, to improve estimates of precipitation from radar given its many applications.
- ECCC should provide public access to more imagery (Doppler and dual-polarization, both current and archived) and reasonable access to full scan radar parameters for universities, other researchers and private companies. There is also a need for metadata including calibration documents.
Acknowledgements
We are grateful to the ECCC for providing surface snowfall measurements and the ECCC King Radar group for providing the Zes data used in the two Hassan et al. papers, and for useful discussion on many other occasions. Dave Hudak, Sudesh Boodoo, Janti Reid, Paul Joe, and David Sills guided us at various stages of our radar work. We are also grateful to Annakaisa von Lerber and Elena Saltikoff at FMI for their input.
References
- Fabry, F., 2015: Radar Meteorology, Principles and Practice, CUP, 256pp.
- Gunn, K. L. S. and J. S. Marshall, 1958: The distribution with size of aggregate snowflakes. J. Meteor. 15, 452–461,
- Hassan, D., P. A. Taylor, and G. A. Isaac, 2017: Snowfall rate estimation using C-band polarimetric radars, Meteor. Appl. 24, 142-156, https://doi.org/10.1002/met.1613
- Hassan, D., P. A. Taylor, G. A. Isaac, 2018: Solid snowfall rate estimation using a C‐band radar, Meteor. Appl. 26, 64-73, https://doi.org/10.1002/met.1737
- Huang G-J, V. N. Bringi, R. Cifelli, D. Hudak, W. A. Petersen, 2010: A methodology to derive radar reflectivity − liquid equivalent snow rate relations using C-band radar and a 2-D video disdrometer. J. Atmos. Oceanic Technol. 27: 637–651, https://doi.org/10.1175/2009JTECHA1284.1
- Huuskonen, A., E. Saltikoff, and I. Holleman, 2014: The Operational Weather Radar Network in Europe. Bull. Amer. Meteor. Soc. 95, 897–907, https://doi.org/10.1175/BAMS-D-12-00216.1.
- Sekhon, R.S. and R. C. Srivastava, 1970: Snow size spectra and radar reflectivity. J. Atmos. Sci. 27, 299–307.
- Smith, P.L. 1984: Equivalent radar reflectivity factors for snow and ice particles. Equivalent radar reflectivity factors for snow and ice particles. J. Appl. Meteor. Climatol. 23: 1258–1260.
About the Authors

Diar Hassan: Diar is a Senior Scientist, Product and Business Development and an Accredited Consultant Meteorologist and Environmental Professional with nearly 20 years of experience. He has served as a consultant meteorologist for an array of clients in different sectors and successful projects. His broad scientific and business development background have proven fruitful in developing new services and products using cost-effective technologies. He has led several projects that encompassed climatological, meteorological, and environmental effects on client operations and logistics.

George A. Isaac: George retired in 2013 as a Senior Scientist from ECCC after 40+ years of service. He formed a small company Weather Impacts Consulting and has continued doing research. He is also active as an Adjunct Professor at York University and Dalhousie University with their Atmospheric Science groups. Current projects include studying winter weather, aircraft in-flight icing, better methods for using weather radar data, and improving forecasts of high impact weather offshore Newfoundland and Labrador.

Peter Taylor: Peter has been a Professor of Atmospheric Science at York University since 1988, when he moved there from the Boundary-Layer Research division of Environment Canada. Most of his research has involved atmospheric boundary-layer flows in complex terrain but his current research has broadened to include fog, precipitation, and radar issues. He is quickly learning how complex things become when water vapor condenses or freezes.

Daniel Michelson: Daniel leads ECCC’s weather radar research program in the Meteorological Research Division. He began working at ECCC in 2015 after 21 years at the Swedish Meteorological and Hydrological Institute. He chairs the WMO Inter-Programme Expert Team in Operational Weather Radars, which includes addressing availability and international exchange of weather radar data. He is also an advocate for Open Science, teaching Open Source radar processing software courses normally held in conjunction with major radar conferences.
Norman Donaldson: Norman has been a radar research scientist at Environment and Climate Change Canada since 1990. He holds math and physics degrees from the University of New Brunswick, Western University and the University of Toronto. His primary interest is in processing radar data and assessing its quality, with the goal of providing usable data to research and operational users. He has contributed to numerous field programs and is activity involved in the scientific direction of ECCC’s radar processing systems.
Did you enjoy this article? Please click here to subscribe to the CMOS Bulletin!
More Like This:
- Replacement of the Canadian Weather Radar Network
- Observing Snow from the Sky: Breakthroughs in mapping tundra snow with drones
Daniel Michelson, Diar Hassan, George Isaac, Norman Donaldson, Peter Taylor, valeurs de réflectivité