
La vague de chaleur sans précédent de juin 2021 dans le nord-ouest du Pacifique
– Par Cuiyi Fei, Rachel H. White, Chris Rodell –
La vague de chaleur extrême qui a eu lieu à la fin du mois de juin 2021 dans la région nord-ouest du Pacifique de l’Amérique du Nord était tellement sans précédent et a eu un tel impact qu’elle continuera probablement d’être étudiée pendant de nombreuses années. Dans le cadre de notre étude interdisciplinaire, dirigée par des chercheurs de l’Université de Colombie-Britannique (White et coll. 2023), nous résumons les conditions qui ont mené à cet événement sans précédent et nous donnons un aperçu des conséquences d’une chaleur inédite. La compréhension de ces événements est particulièrement pertinente dans le contexte de notre monde en réchauffement.
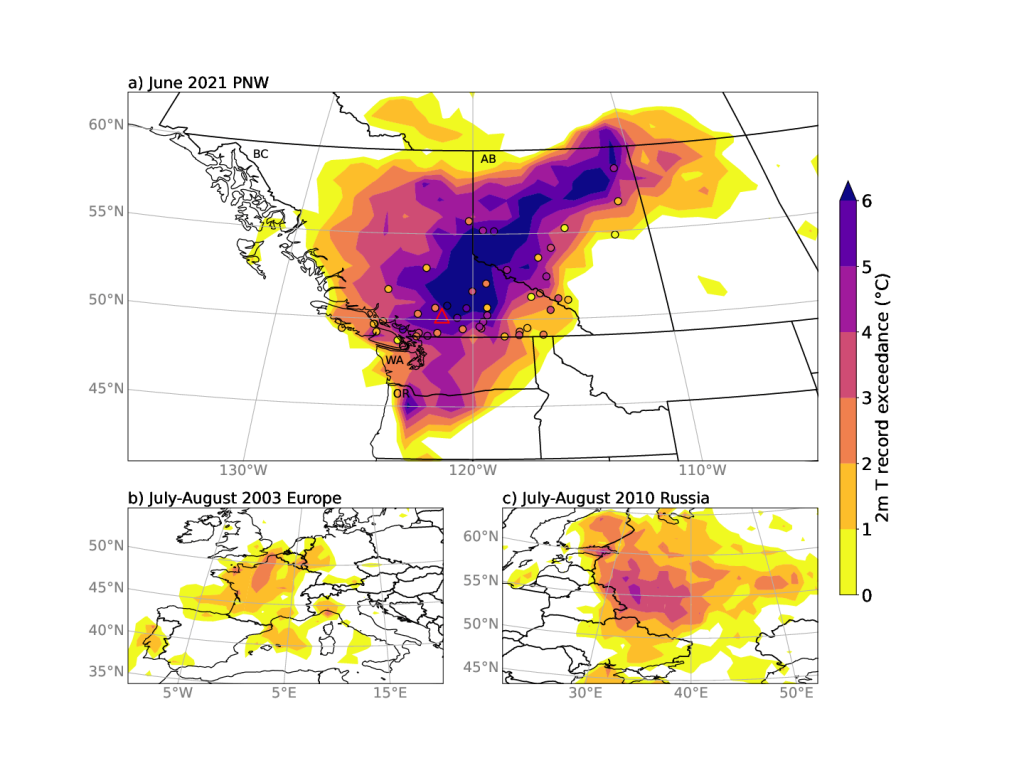
La figure 1 montre à quel point les records locaux ont été battus pendant cette vague de chaleur, avec une comparaison avec deux autres vagues de chaleur notoires : en Europe en 2003 et en Russie en 2010. La vague de chaleur du nord-ouest du Pacifique a battu les records de température des 70 dernières années de plus de 6 degrés, en faisant un événement sans précédent par rapport à la plupart des vagues de chaleur (voir également Thompson, et coll., 2022). En fait, elle est devenue l’un des événements météorologiques extrêmes les plus graves des dernières décennies dans le monde entier et a battu le record national de température du Canada de 4,6 degrés. Bien que la vague de chaleur n’ait duré qu’environ cinq à six jours, soit moins longtemps que les deux autres événements mentionnés dans la figure 1, elle n’en a pas moins été dévastatrice. La température maximale de 49,6°C a été atteinte à Lytton, une petite ville située dans une vallée aride de la Colombie-Britannique, et une grande partie de la ville de Lytton a été tragiquement détruite par un incendie de forêt pendant la vague de chaleur.
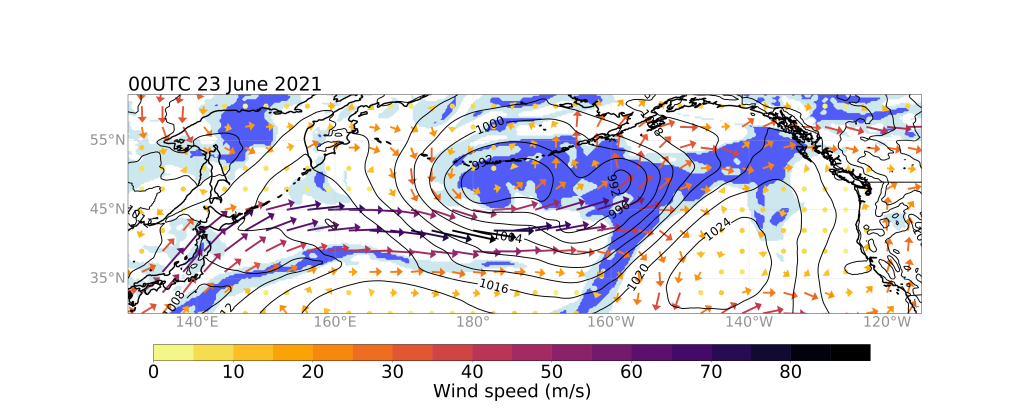
Bien qu’aucune théorie globale et quantitative ne puisse être appliquée universellement à tous les événements de températures extrêmes, les vagues de chaleur en été peuvent souvent être attribuées à des anticyclones de blocage – un système de haute pression qui est immobile ou qui se propage lentement. Ces anticyclones de blocage sont souvent associés à la subsidence, au réchauffement radiatif en ciel clair et aux rétroactions terre-atmosphère (Pfahl et Wernli, 2012), qui contribuent tous à l’élévation des températures de surface. La contribution des différents facteurs varie d’un événement à l’autre (Röthlisberger et Papritz, 2023). Dans le cas de cette vague de chaleur, les conditions atmosphériques précédentes sont illustrées à la figure 2, avec une crête et une pression moyenne élevée au niveau de la mer juste au large de la côte ouest de l’Amérique du Nord, qui s’est transformée en une configuration de blocage au cours des quelques jours suivants. L’humidité relative élevée en amont (illustrée par l’ombrage bleu) a fourni un chauffage latent attribuable à la condensation de la vapeur d’eau, contribuant à la température anormalement élevée et soutenant probablement la crête de haute pression (Oertel et coll., 2023). Nos résultats révèlent qu’environ 78% (équivalant à environ 14 degrés) de l’anomalie de température près de la surface est due au chauffage diabatique en amont du blocage.
En ce qui concerne les impacts météorologiques et océanographiques, l’une des conséquences directes de la vague de chaleur a été une hausse marquée des incendies de forêt. Le nombre d’incendies de forêt en Colombie-Britannique est passé de six le 20 juin avant la vague de chaleur à 175 le 3 juillet, juste après la vague de chaleur, la zone touchée par les incendies de forêt ayant été multipliée par un facteur d’environ 640 au cours de cette période. Outre les températures extrêmement élevées, les incendies de forêt ont fourni de la chaleur, des particules de fumée et de la vapeur d’eau pour la formation de nuages convectifs. L’humidité en amont de la troposphère moyenne a par la même occasion apporté une contribution indispensable aux nuages convectifs. Ces nuages convectifs ont à leur tour produit une grande quantité d’éclairs, allumant et renforçant les incendies de forêt. Selon le Centre interservices des feux de forêt du Canada (CIFFC), la foudre a déclenché au moins 127 incendies de forêt entre le 30 juin et le 2 juillet.
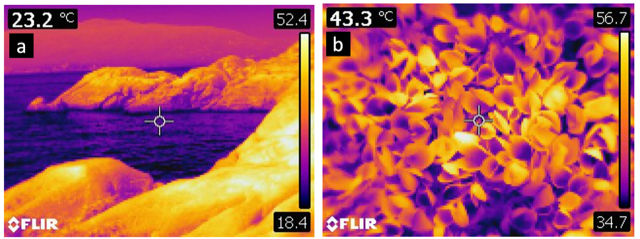
Du même coup, cet événement a eu des répercussions importantes sur la vie marine, en particulier sur les espèces intertidales. La figure 3 montre des images thermiques de moules et du littoral intertidal rocheux sur lequel elles se trouvaient. Pendant la vague de chaleur, la température des rochers et de certaines moules a dépassé 50°C, entraînant une mortalité importante (comme en témoignent les moules béantes). Cette mortalité à grande échelle a touché diverses espèces depuis l’extrémité sud de Puget Sound, dans l’État de Washington, jusqu’à la côte centrale de la Colombie-Britannique, le nombre total d’invertébrés marins tués se chiffrant très certainement en milliards (Raymond et coll., 2022).
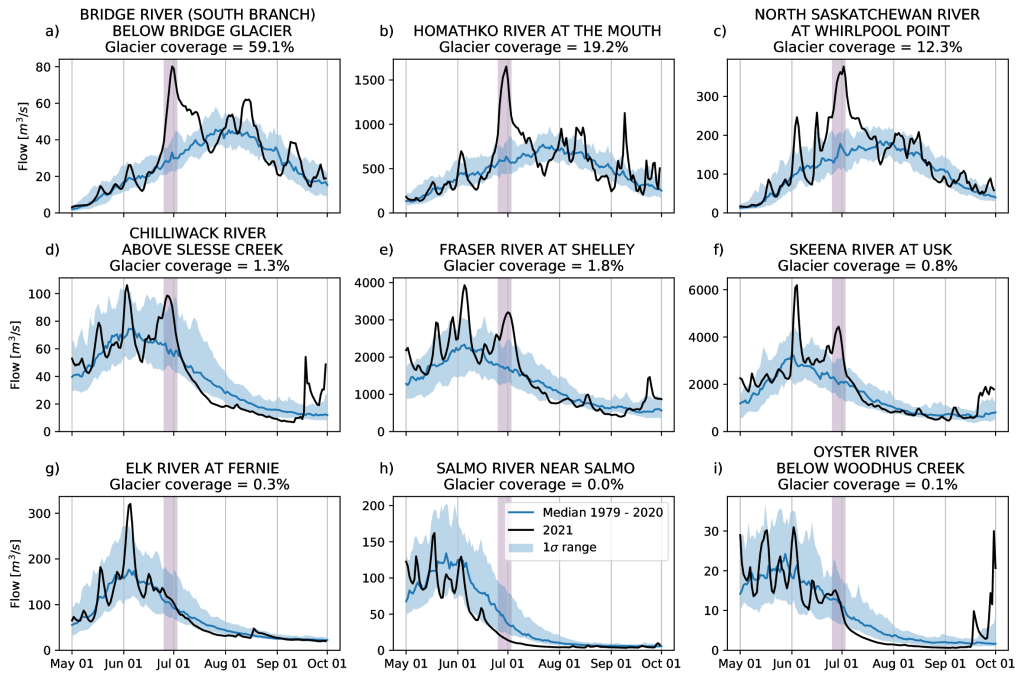
Outre les effets directs sur la température, la vague de chaleur extrême a également augmenté le débit des cours d’eau en Colombie-Britannique en faisant fondre la glace et la neige. La figure 4 montre des pics importants de débit coïncidant avec la vague de chaleur dans les bassins fortement ou modérément englacés (lignes du haut et du milieu respectivement), tandis que les zones à faible couverture glaciaire (et donc probablement à faible couverture neigeuse) ont observé des changements minimes pendant la vague de chaleur (ligne du bas). Après la vague de chaleur, le débit dans les zones à couverture glaciaire modérée ou faible était généralement inférieur aux valeurs climatologiques (lignes du milieu et du bas). En revanche, le débit des bassins glaciaires est resté proche de la moyenne climatologique (ligne du haut), ce qui a certainement été obtenu au prix d’une perte de masse glaciaire potentiellement irréversible. La gestion des ressources en eau pourrait s’avérer essentielle pendant et après les vagues de chaleur extrêmes à l’avenir, car la capacité des glaciers à soutenir le débit des cours d’eau pourrait diminuer à mesure que les glaciers continuent de fondre en réponse au changement climatique (Clarke et coll., 2015).
– By Cuiyi Fei, Rachel H. White, Chris Rodell –
The extreme heatwave that occurred at the end of June 2021 across the Pacific Northwest region of North America was so unprecedented and impactful that it will likely continue to be studied for many years. In our cross-disciplinary study, led by researchers at the University of British Columbia (White et al. 2023), we summarize the conditions leading up to this record-shattering event, and provide insights into the impacts of such unprecedented heat. Understanding such events is particularly relevant in the context of our warming world.
The degree by which local records were broken during this heatwave is shown in Figure 1, with a comparison to two other notorious heatwaves: in Europe in 2003 and Russia in 2010. The Pacific Northwest heatwave broke 70-year temperature records by more than 6 degrees, making it far more unprecedented than most heatwaves (see also Thompson, et al., 2022). In fact, it became one of the most severe extreme weather events in the past decades around the world and broke the national temperature record of Canada by 4.6 degrees. Although the heatwave lasted only around five to six days, shorter than the other two events included in Figure 1, it was still devastating. The maximum heatwave temperature of 49.6C was reached in Lytton, a small town in an arid valley of BC, and much of the town of Lytton was tragically destroyed in a wildfire during the heatwave.
Whilst no single comprehensive and quantitative theory can be universally applied to all extreme temperature events, heatwaves in summer can often be attributed to blocking highs — a high-pressure system that is stationary or propagating slowly. These blockings highs are often associated with subsidence, clear sky radiative warming and land-atmosphere feedbacks (Pfahl and Wernli, 2012), all contributing to high surface temperatures. The contribution of different factors varies from one event to another (Röthlisberger and Papritz, 2023). In the case of this heatwave, the preceding atmospheric conditions are shown in Figure 2, with a ridge and high mean sea level pressure just off the west coast of North America, which developed into a blocking pattern in the next few days. High upstream relative humidity (shown in the blue shading) provided latent heating from water vapor condensation, contributing to the anomalously high temperature and likely sustaining the high-pressure ridge (Oertel et al., 2023). Our findings demonstrate that approximately 78% (equivalent to around 14 degrees) of the near-surface temperature anomaly was due to the diabatic heating upstream of the blocking.
The high temperatures of this heatwave, as illustrated in Figure 1, had a catastrophic impact on human health. A total of 868 deaths have, so far, been attributed to the heatwave, and emergency visits for heat-related illnesses in some impacted regions were 69 times higher compared to the same period in 2019.
Turning to the meteorological and oceanographic impacts, one direct consequence of the heatwave was a significant increase in wildfires. The number of wildfires in BC increased from six on June 20th before the heatwave to 175 on July 3rd, just after the heatwave, with the area affected by wildfires increasing by a factor of about 640 during this period. In addition to extremely high temperatures, the wildfires provided heat, smoke particles and water vapor for convective cloud formation. Upstream mid-troposphere moisture also had an indispensable contribution to the convective clouds. These convective clouds, in turn, produced a large amount of lightning, igniting and strengthening wildfires. According to the Canadian Interagency Forest Fire Centre (CIFFC), lightning triggered at least 127 wildfires from June 30th to July 2nd.
This event also had significant impacts on marine life, particularly intertidal species. Figure 3 shows thermal images of mussels and the rocky intertidal shoreline they were on. During the heatwave, the temperature of the rocks, as well as some of the mussels, exceeded 50°C, leading to significant deaths (as evidenced by the mussels gaping open). Such large-scale mortality occurred across various species from the southern end of Puget Sound, Washington State, to the BC Central Coast, with the total number of killed marine invertebrates almost certainly in the billions (Raymond et al., 2022).
In addition to the direct temperature impacts, the extreme heatwave also increased streamflow in British Columbia by melting ice and snow. Figure 4 shows substantial peaks in streamflow coinciding with the heatwave in heavily or moderately glaciated basins (top and middle rows respectively), while areas with little glacier coverage (and therefore likely little snow cover) experienced minimal change during the heatwave (bottom row). After the heatwave, streamflow in areas with moderate or little glacier coverage was typically lower than climatological values (middle and bottom row). In contrast, the streamflow from glaciated basins remained close to the climatological average (top row); this was almost certainly achieved at the cost of potentially irreversible glacier mass loss. Managing water resources may be critical during and after extreme heatwaves in the future, as the ability of glaciers to sustain streamflow may diminish as glaciers continue to melt in response to climate change (Clarke et al., 2015).
This unprecedented heatwave is a vivid example of a record-shattering mid-latitude heatwave, illustrating some potential effects of extreme heat. There is no doubt that increasing background temperatures due to anthropogenic climate change made this heatwave hotter and, therefore, more extreme; however, the recording-breaking temperatures of recent extreme weather events such as this heatwave are a combination of anthropogenic climate trends and internal variability that has always been able to cause large anomalies in temperature. Understanding of our complex interacting climate system remains incomplete and quantitative estimates of the contribution of anthropogenic factors to this heatwave have relatively large uncertainties due to the many interacting factors that may have played a role, including moisture and land-atmosphere feedbacks and possible anthropogenically-forced changes to atmospheric circulation patterns. Long-term adaptation in response to long-term climate change and the short-term response to extreme events have both overlapping and separate components (Dolan, 2021). To reduce the impacts of future heatwaves, it is imperative that we understand, mitigate, and adapt on both timescales.
While anthropogenic climate change was not the sole cause of this event, this heatwave presents an opportunity to enhance people’s awareness and preparedness. Even though many future extreme weather events may not be as unprecedented as this heatwave, it is undeniable that global warming will result in more record-shattering heatwaves in the future (Fischer et al. 2021). Hence, it is vital to take proactive measures toward climate adaptation, including building infrastructure, improving emergency response, and promoting sustainable strategies such as the use of clean energy in the industry, agriculture, and people’s daily lives. We must build resilience against extreme events and climate change for a safer and more sustainable future.
Cuiyi Fei is a PhD Candidate in the Department of Earth, Ocean and Atmospheric Sciences at University of British Columbia. She is working on understanding the mechanism of quasi-stationary waves, but she has a broad interest in general circulation in the atmosphere and ocean.
Rachel White is an Assistant Professor in Atmospheric Science in the Department of Earth, Ocean and Atmospheric Sciences at University of British Columbia. Her research interests include large-scale climate dynamics, connections between atmospheric circulation patterns and extreme weather events, and the subseasonal to seasonal predictability of extremes.
Chris Rodell is a PhD Candidate in Atmospheric Science at the University of British Colombia. His focus is on Fire Weather, Behaviour and Smoke forecasting.
References
Clarke, G.K., Jarosch, A.H., Anslow, F.S., Radić, V. and Menounos, B., 2015. Projected deglaciation of western Canada in the twenty-first century. Nature Geoscience, 8(5), pp.372-377. https://www.nature.com/articles/ngeo2407
Emerton, R., Brimicombe, C., Magnusson, L., Roberts, C., Di Napoli, C., Cloke, H.L. and Pappenberger, F., 2022. Predicting the unprecedented: forecasting the June 2021 Pacific Northwest heatwave. Weather, 77(8), pp.272-279. https://rmets.onlinelibrary.wiley.com/doi/10.1002/wea.4257
Fischer, E.M., Sippel, S. and Knutti, R., 2021. Increasing probability of record-shattering climate extremes. Nature Climate Change, 11(8), pp.689-695. https://www.nature.com/articles/s41558-021-01092-9
Oertel, A., Pickl, M., Quinting, J.F., Hauser, S., Wandel, J., Magnusson, L., Balmaseda, M., Vitart, F. and Grams, C.M., 2023. Everything hits at once: How remote rainfall matters for the prediction of the 2021 North American heat wave. Geophysical Research Letters, 50(3), p.e2022GL100958. https://agupubs.onlinelibrary.wiley.com/doi/full/10.1029/2022GL100958
Pfahl, S. and Wernli, H., 2012. Quantifying the relevance of atmospheric blocking for co‐located temperature extremes in the Northern Hemisphere on (sub‐) daily time scales. Geophysical Research Letters, 39(12). https://agupubs.onlinelibrary.wiley.com/doi/full/10.1029/2012GL052261
Raymond, W.W., Barber, J.S., Dethier, M.N., Hayford, H.A., Harley, C.D., King, T.L., Paul, B., Speck, C.A., Tobin, E.D., Raymond, A.E. and McDonald, P.S., 2022. Assessment of the impacts of an unprecedented heatwave on intertidal shellfish of the Salish Sea. Ecology, 103(10). https://esajournals.onlinelibrary.wiley.com/doi/10.1002/ecy.3798
Röthlisberger, M. and Papritz, L., 2023. Quantifying the physical processes leading to atmospheric hot extremes at a global scale. Nature Geoscience, pp.1-7. https://www.nature.com/articles/s41561-023-01126-1
Thompson, V., Kennedy-Asser, A.T., Vosper, E., Lo, Y.E., Huntingford, C., Andrews, O., Collins, M., Hegerl, G.C. and Mitchell, D., 2022. The 2021 western North America heat wave among the most extreme events ever recorded globally. Science Advances, 8(18), p.eabm6860. https://www.science.org/doi/full/10.1126/sciadv.abm6860
White, R.H., Anderson, S., Booth, J.F., Braich, G., Draeger, C., Fei, C., Harley, C.D., Henderson, S.B., Jakob, M., Lau, C.A., Mareshet Admasu, L., Narinesingh, V., Rodell, C., Roocroft, E., Weinberger, K.R., and West, G. 2023. The unprecedented Pacific Northwest heatwave of June 2021. Nature Communications, 14(1), p.727. https://doi.org/10.1038/s41467-023-36289-3
canicule, chris rodell, cuiyi fei, heatwave, nord-ouest du pacifique, pacific northwest, rachel white