
Incendies de forêt extrêmes dans les Territoires du Nord-Ouest en 2014
– Par Bob Kochtubajda1, Ron Stewart2, Mike Flannigan3, Barrie Bonsal1, Charles Cuell4, and Curtis Mooney1 –
1. Environnement et Changement climatique Canada; 2. Université du Manitoba, Winnipeg, MB; 3. Universite de l’Alberta, Edmonton, AB; 4. CHMR Conseil en résilience climatique, Kaslo, BC.
Les médias du monde entier ont souligné la nature extrême et sans précédent des incendies de forêt survenus ces dernières années, par exemple au Chili (2017), au Portugal (2017), en Grèce (2018), en Californie (2017) et en Europe (2018). Au Canada, l’incendie de forêt de Fort McMurray en 2016 est le troisième de l’histoire de l’Alberta en importance. Il reste la catastrophe naturelle la plus coûteuse de l’histoire du Canada, avec environ 3,6 milliards de dollars de pertes assurées (1).
Au cours de l’été 2014 dans les Territoires du Nord-Ouest (T. N.-O.), les incendies de forêt ont brûlé une étendue record de forêt boréale (3,39 Mha ou 33 900 km2), soit un peu plus que la superficie de l’île de Vancouver.
Notre étude récente publiée dans Atmosphere-Ocean (DOI : 10.1080/07055900.2019.1576023) examine les conditions atmosphériques et en surface relevées pendant la saison 2014, et les compare aussi avec des données antérieures.
L’analyse indique que la saison d’incendies de forêt extrêmes de 2014 résultait de plusieurs facteurs. Les conditions très sèches en surface à l’automne 2013 ont persisté tout au long de l’hiver et au printemps suivants, une situation propice aux incendies extrêmes. Ces conditions, combinées à la formation et à l’affaissement de crêtes dans la troposphère moyenne au cours de l’été, ont engendré un nombre record d’éclairs nuage-sol, d’incendies de forêt allumé par la foudre et d’hectares brûlés.
En conclusion, cette étude permet une compréhension accrue de l’incidence des conditions météorologiques, de la foudre et des régimes de circulation de la troposphère moyenne en ce qui concerne la saison des incendies de forêt en 2014. À mesure que le climat se réchauffe, les hautes latitudes pourraient voir une augmentation de la persistance des systèmes de grande échelle (8) et de la fréquence d’événements extrêmes (9). Plusieurs études indiquent également que les conditions météorologiques propices aux incendies forestiers s’aggraveront; que les éclairs, les étendues brûlées et la fréquence des jours propices aux incendies extrêmes augmenteront; que les combustibles s’assécheront et que la durée de la saison des incendies augmentera (10). Une telle perspective favoriserait vraisemblablement les conditions de sécheresse et de chaleur extrêmes, et les saisons d’incendie extrême.
Media reports around the world have highlighted the extreme and unprecedented nature of wildfires in recent years (e.g. Chile 2017, Portugal 2017, Greece 2018, California 2017 and 2018). In Canada, the 2016 Fort McMurray wildfire was the third largest in Alberta’s history and became the costliest natural disaster in Canadian history, with approximately $3.6 billion in insured losses (1). Wildfires in British Columbia scorched record areas of forest in 2017 and again in 2018. In Ontario, the total number of wildfires and area burned during the 2018 wildfire season were nearly double the latest provincial 10-year average (2). During the summer of 2014, wildfires burned a record 3.39 Mha (33,900 km2, an area slightly larger than Vancouver Island) of boreal forest in the Northwest Territories (NWT).
Our recent study published in Atmosphere-Ocean (DOI: 10.1080/07055900.2019.1576023) examines the surface and atmospheric conditions during that season including their comparison within the historical record. Detailed analyses of such extreme wildfire seasons contribute to better understanding the many associated interactions of weather, lightning and mid-tropospheric circulation patterns.
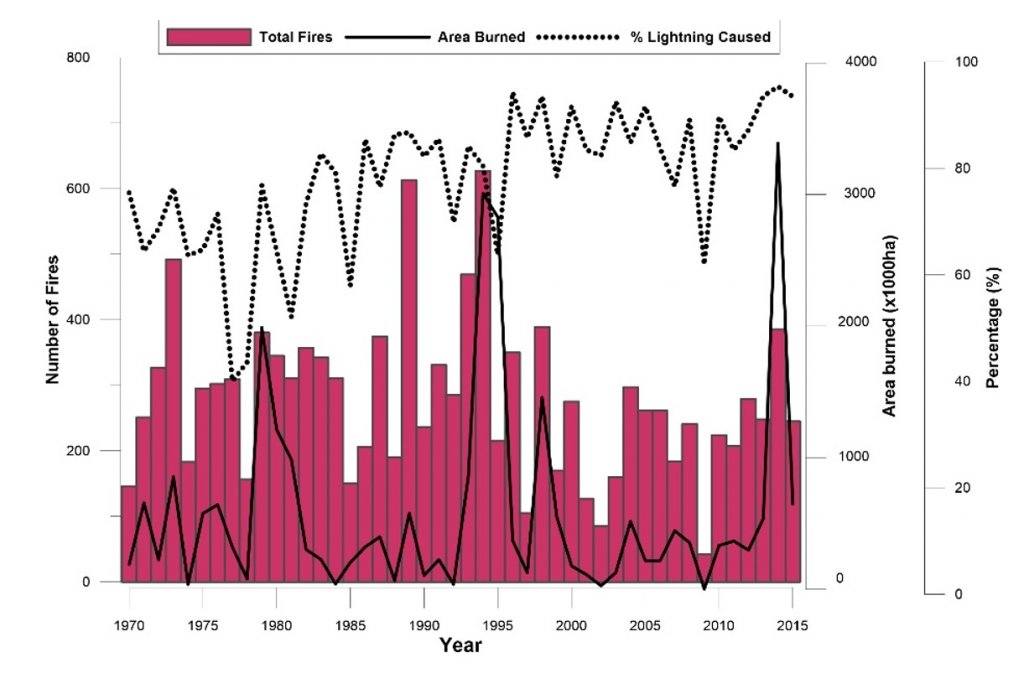
Wildfire represents an important disturbance in NWT. It shapes landscape diversity, controls insects and diseases and maintains biological diversity, but it also represents a threat to human life, property, and valuable commercial resources (3). The history of wildfires in NWT from 1970 to 2015, shown in Fig. 1, highlights the exceptional 2014 fire season. There are three factors that influence wildfire activity: dry fuel, an ignition source and weather conditions (4). The variability in the number of wildfires and areas burned is due to year-to-year differences in those factors.
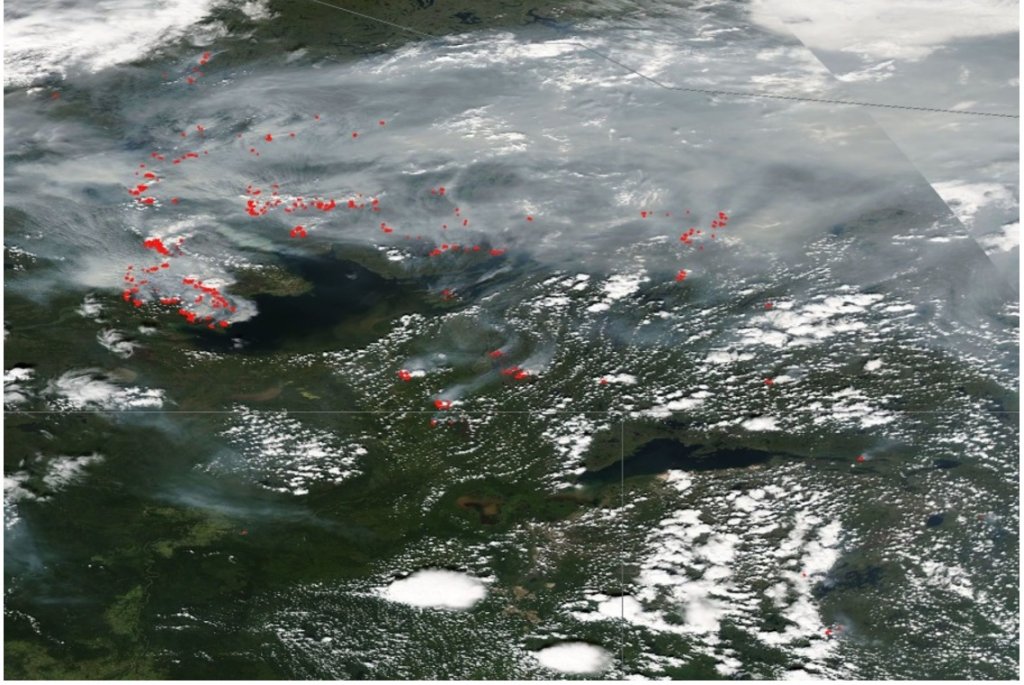
The majority of the 2014 wildfires occurred in regions surrounding Great Slave Lake, and smoke from the mostly lightning-caused wildfires led to dramatically poor air quality and visibility reductions that resulted in numerous health alerts, road closures and frequent exceedances of PM2.5 ambient air quality standards. For example, Fig. 2 shows numerous hotspots near Great Slave Lake and the extensive smoke plumes on July 29, 2014. Such prolonged smoke events impacted the mental and emotional well-being of residents as well as their livelihoods among affected communities (5). If we assume an average emission from forest fires of about 170 tonnes of carbon dioxide equivalent per hectare (6), the wildfires in NWT in 2014 were estimated to release 580 megatonnes of CO2 equivalent, which is about 79% of Canada’s annual GHG emissions (this excludes emissions from wildfires and various land-use and forestry activities).
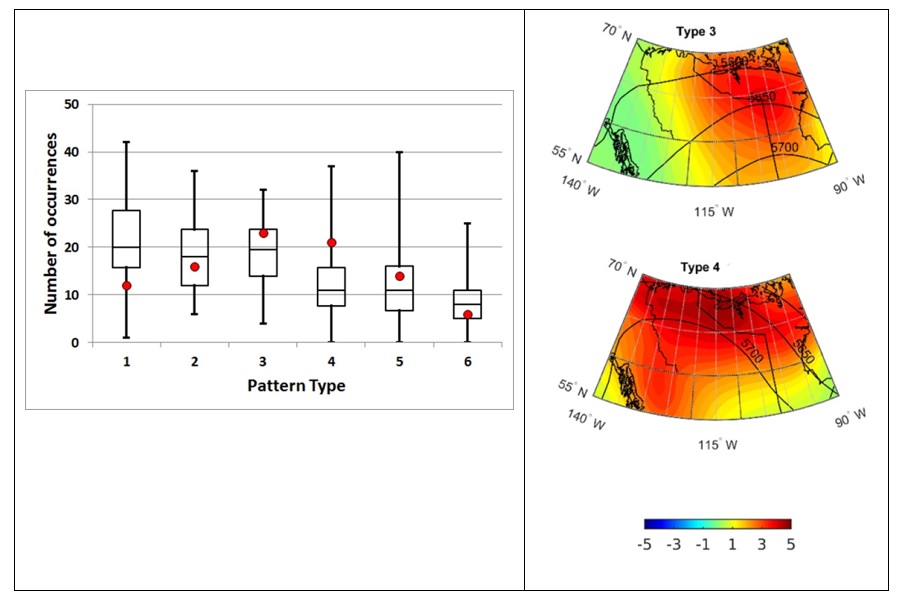
This study analyzed a variety of observational and model data sources. These included the archived lightning flash data from the Canadian Lightning Detection Network; fire data from the National Forestry Fire database; climate data from the Environment and Climate Change Canada database; and NCEP-NCAR reanalysis data. Mid-tropospheric atmospheric circulation over a large region including NWT during the period 1948-2015 was classified into the six most common summer patterns using a cluster analysis (7). An assessment of circulation patterns over NWT in 2014 showed that the frequencies of ridging and subsequent ridge displacement or breakdown patterns were much higher than normal (Fig. 3). Ridge patterns are commonly associated with warm, dry conditions which tend to dry the surface and forest floor. The breakdown of these ridges often leads to thunderstorm formation from which lightning can ignite wildfires.
The overall analysis results indicate that the 2014 extreme wildfire season was linked to several factors. Very dry surface conditions in the fall of 2013 continued through the winter and the following spring and this led to conditions that were suitable for extreme fires. These conditions, combined with a persistence of mid-tropospheric ridging and ridge breakdown patterns during the summer, led to record numbers of cloud-to-ground (CG) flashes, lightning-initiated forest fires and area burned. A record number of positive-polarity CGs (bringing positive charge to the surface) was also detected and this is consistent with the findings of previous studies of thunderstorms in smoke-filled environments. The common view is that such positive flashes are more likely to ignite wildfires than negative ones. However, our assessment showed that more wildfires were associated with negative-only CGs than positive-only ones but their ignition efficiencies (wildfire ignitions per number of flashes) were similar.
In conclusion, this study has advanced our understanding of the roles of weather, lightning and mid-tropospheric circulation patterns in the 2014 wildfire season. As the future climate warms, northern latitudes may experience greater persistence of large-scale circulation patterns (8) and an increase in the occurrence of extreme events (9). Several studies have also suggested that fire weather is projected to become more severe; lightning, area burned and the frequency of extreme fire weather days are expected to increase; fuels will be drier; and fire seasons are predicted to be longer (10). Such future conditions would likely make NWT more prone to extreme dry and warm conditions and extreme fire seasons.
References
(1) http://www.ibc.ca/ab/resources/media-centre/media-releases/northern-alberta-wildfire-costliest-insured-natural-disaster-in-canadian-history
(2) https://www.ontario.ca/page/forest-fires
(3) Ward and Mawdsley 2000, In ‘Fire, climate change and carbon cycling in the boreal forest’ (Eds ES Kasischke, BJ Stocks).
(4) Flannigan and Wotton 2001, In: ‘Forest fires: Behaviour and ecological effects.’ (Eds EA Johnson, K Miyanishis).
(5) Dodd et al. 2018, DOI: 10.17269/s41997-018-0070-5
(6) https://edmontonjournal.com/news/local-news/carbon-release-in-wake-of-fort-mcmurray-wildfire-spikes-greenhouse-gasses
(7) Cuell and Bonsal 2009, DOI: 10.1007/s00704-009-0119-8
(8) Mann et al. 2017, DOI: 10.1038/srep45242
(9) IPCC, 2014, Impacts, Adaptation, and Vulnerability. Part B: Regional Aspects.
(10) Flannigan et al. 2009, DOI: 10.1071/WF08187
About the Author

Bob Kochtubajda is a physical scientist with Environment and Climate Change Canada (Prediction Services West Division of the Meteorological Service) in Edmonton.
His areas of interest are in hydro-meteorological extremes and atmospheric hazards processes and in the use of lightning data for meteorological applications.
This study was a joint ECCC-University collaboration contributing to the recently completed Changing Cold Regions Network.
Plus comme ça :
Bob Kochtubajda, changement climatique, Environnement et Changement climatique Canada, Incendies de forêt, Territoires du Nord-Ouest