
L’observation de la neige à partir du ciel : avancées dans la cartographie de la neige de la toundra à l’aide de drones
– Par Branden Walker et Philip Marsh, Cold Regions Research Centre, Université Wilfrid Laurier, Waterloo, Ontario –
La neige n’est pas uniformément répartie sur la toundra arctique. Les vents forts de l’hiver et la végétation basse facilitent l’érosion, le transport et le dépôt de la neige partout sur cette étendue ouverte, et ainsi entraînent une répartition inégale de l’épaisseur, de la densité et de l’équivalent en eau de la neige. Il est de la plus haute importance de comprendre la répartition de la neige dans ce milieu, car les quantités hivernales de neige dans ces régions nordiques couvrent souvent le sol durant 8 à 9 mois, représentent plus de la moitié des précipitations annuelles et s’avèrent le facteur dominant du système hydrologique. La couverture de neige influe aussi grandement sur l’albédo de la surface et son action se répercute sur le temps et le climat. Avec le début de la fonte printanière (événement qui ne dure que quelques courtes semaines), nous observons une libération rapide des précipitations accumulées, qui se traduit souvent par des crues nivales représentant 60 à 80 % du débit annuel des cours d’eau. Afin de mieux comprendre comment les paramètres hydrologiques de cet environnement réagiront au renforcement du réchauffement climatique, il faut mesurer efficacement et avec exactitude l’eau stockée sous forme de neige.
Le groupe de recherche en hydrologie arctique (AHRG) s’est efforcé de résoudre ces problèmes en testant le fonctionnement de plusieurs nouveaux dispositifs d’observation de la neige dans le bassin hydrologique de recherche, dominé par la toundra, de Trail Valley Creek, situé au nord d’Inuvik (T.N.-O.). Par exemple, mentionnons le système d’aéronef télépiloté (SATP, communément appelé « drone ») pour mesurer la neige. Ces dernières années, nous avons défini et testé des méthodologies d’utilisation de SATP pour cartographier à haute résolution la couverture nivale de la toundra à l’échelle des bassins versants. Pour ce faire, nous appliquons la technique de photogrammétrie d’acquisition des structures à partir d’un mouvement (Structure-from-Motion ou SfM) à l’imagerie aérienne enregistrée à l’aide d’un SATP à voilure fixe (Sensefly eBee+). Cette méthode permet de produire des cartes à haute résolution de l’élévation de la surface de la couche nivale, qui, une fois soustraite de l’élévation de la surface libre de neige, donne des cartes d’épaisseur de neige. En outre, nous pouvons calculer l’aire enneigée et, grâce aux estimations de la densité de la neige, nous pouvons également cartographier l’équivalent en eau à des résolutions spatiales et temporelles impossibles à obtenir avec les méthodes traditionnelles. Ces données se révèlent très importantes pendant la brève période de fonte printanière de la neige, où une fonte inégale entraîne un ruissellement localisé des eaux de fonte vers les cours d’eau et influe sur le moment et l’ampleur de la crue nivale.
Snow is not evenly distributed across Arctic tundra landscapes. Strong winter winds and low-lying vegetation allow snow to easily be eroded, transported and deposited across the open landscape resulting in a heterogenous distribution of snow depth, snow density, and snow water equivalent (SWE). Understanding the distribution of snow in these environments is of upmost importance as the winter snow accumulation in these northern regions often covers the ground for 8 to 9 months, accounts for over half of the annual precipitation, and is the dominant driver of the hydrological system. Snowcover also greatly influences surface albedo with feedbacks to the weather and climate. With the onset of the spring melt (an event that lasts only a few short weeks) we observe a rapid release of accumulated precipitation, often resulting in spring freshet events that account for 60-80 percent of the annual stream discharge. To better understand how the hydrology of these environments will respond to a further warming climate it is necessary to accurately and efficiently measure the water stored as snow.
At present our ability to accurately measure snow at hillslope to watershed scales using standard snow survey methods, point sensors at weather stations or remote sensing techniques has proven difficult, whereby these methods often fail to accurately represent small-scale spatial and temporal variations in snow accumulation and melt. In tundra environments this raises issues as a significant portion of the SWE is found in relatively small drifts features located on leeward hillslopes and within tall shrub patches. These drift and vegetation features may only account for 20 percent of the watershed area, but they often contain 2-4 times more water storage when compared to open tundra regions and release meltwater later into the spring snowmelt period. Developing methods that accurately measure snow at the across this snowdrift scale is of critical importance in order to both document snow across the watershed, and for developing appropriate hydrologic and earth system models.
The Arctic Hydrology Research Group (AHRG) has been working to address these issues through testing and application of multiple novel snow observing sensors in the tundra dominated Trail Valley Creek Research Basin located north of Inuvik, NWT. One such example is the application of Remotely Piloted Aircraft Systems (RPAS, commonly referred to as “drones”) for measuring snow. For the past few years we have been developing and testing methodologies for using RPAS to map high-resolution tundra snow cover at watershed scales. To do this we apply Structure-from-Motion (SfM) photogrammetry to aerial imagery collected using a fixed-wing RPAS (Sensefly EBEE+). This enables the production of high-resolution maps of the snowpack surface elevation, which when subtracted from a snow-free elevation provides maps snow depth. In addition, we can calculate Snow Covered Area (SCA) and using estimates of snow density we can also map SWE at spatial and temporal resolutions unobtainable using traditional methods. This is very important over the brief spring snowmelt period, where heterogenous snowmelt patterns result in localized snowmelt runoff to the stream channels affecting the timing and magnitude of the spring freshet event.
The flexibility to capture daily- or sub daily- changes to the snow enables us to document changes to the watershed snowcover at unprecedented temporal and spatial scales with decimeter vertical accuracy. For several years our research has focused on using RPAS to map end-of-winter snow cover for multiple headwater watersheds and documenting changes over the spring snowmelt period. Results from 5 years of extensive field campaigns resulting in thousands of ground validation survey points conclude we can accurately measure snow depth in these environments with error estimates ranging from 8 to 30cm, with a consistent positive bias.
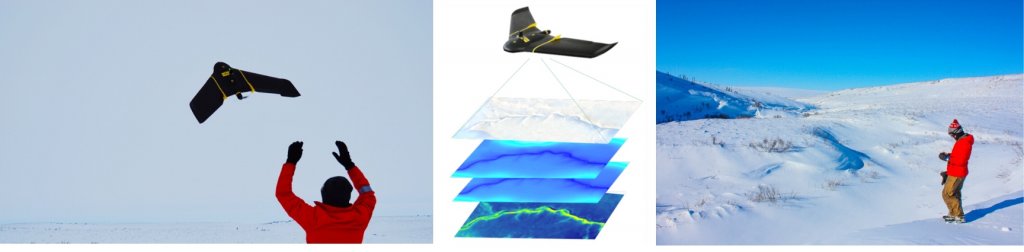
Centre: Mapping snow depths using RPAS and Structure-from-Motion photogrammetry. A conceptual overview.
Right: Hetergenity in snow depths and landcover type within Trial Valley Creek. Note the large drift features where blowing snow accuulates all winter. Photo Credit to Thomas Misztela
This past winter (2018-19) we had the opportunity to collect snow depth using RPAS through a collaboration with Environment and Climate Change Canada’s (ECCC) TVCSnow airborne radar campaign (Follow along on Twitter #TVCSnow). We successfully collected SfM snow depth data for five winter dates for a small headwater watershed, Siksik Creek, located within the Trail Valley Creek Research Basin, north of Inuvik, NWT. Continued flights were conducted over the 2019 spring melt period beginning at the end of April. To ensure accuracy and precision of the RPAS snow-surface elevation models we incorporated manual Ground Control Points (GCPS) surveyed across the study area with a high-precision Real-Time Kinematic (RTK) GNSS. This increases our snow-surface elevation model accuracy to ±2-5cm when directly compared to RTK measurements of snow surface elevation.
Preliminary analysis of the data provides valuable insights into the spatial and temporal accumulation patterns across the watershed, whereby we can directly measure changes in snow depth and SCA across the basin. Here we observe heterogeneity in snow accumulation by land cover type following snow precipitation and blowing snow events with great accuracy across a 1 km2 watershed. Over the 2018-19 winter snow accumulation period we measured little change across most tundra and short shrub sites as that the snow carrying capacity of these regions was filled very early in the winter and did not increase for the remainder of the winter. With all additional snow removed by blowing snow and accumulated in drifts. In contrast, we observe stark increases in drift and tall shrub regions snow depths, specifically on steep (slope >10˚) north-NE facing slopes resulting from sporadic mid-winter blowing snow events. These results agree with present literature of snow distribution patterns across the Arctic; however, we now possess the ability to quantify these changes at fine resolutions which will serve as important useful datasets to balance our measurements of snowfall and snow on the ground and validate high-resolution spatially distributed snow models.
Measurement of snowpack conditions continued across the 2019 spring melt period for the Siksik Creek basin to provide a detailed documentation of snow ablation patterns during the melt period. Specifically, we assessed changes to snow covered area (SCA) and snow depth across the four dominant landcover types. When combined with spatially distributed snow density estimates we were able to map changes in SWE, and hence snowmelt contribution to runoff. To our knowledge, this ability has not been demonstrated in any other studies in the Arctic. Not surprisingly, we observed distinct snowmelt patterns based on landcover type throughout the melt period. Notably we found a rapid decline in SCA for areas dominated by short shrubs (height <0.5m) such as dwarf birch, followed closely by the shallow snowpacks across open tundra regions. Short shrub dominated regions melt out completely days before the remainder of the snowpack, a result of their shallow snowpacks, favorable slope and aspect to incoming radiation, and localized melting caused by radiative transfer through the shrubs woody material into the snowpack. In contrast, the SCA for deep snowpacks found in the tall shrub and drift sites decreases slowly over a period of a few weeks. Previous research has demonstrated these areas contain a high SCA late into the melt period, lasting days or even weeks after the majority of the basin becomes snow-free. This is important as they contain a relatively large proportion of snow-water storage and provide meltwater runoff to the stream systems late after the initial freshet discharge event. Furthermore, the timing of snow removal was recently found as one of the most influential factors affecting the seasonal development of the active-layer in the Siksik Creek basin (Wilcox et al. 2019), highlighting the need for ongoing research to better understand how a changing snowcover may influence future permafrost.
Further analysis of the dataset will provide valuable insights into the effects of blowing snow events on the timing and magnitude of drift development, spatial patterns in snow water storage, and spatial snowmelt patterns. This becomes important with the onset of the snowmelt as we quantify the spatial heterogeneity of snowpack ablation and snow-free onset spatially across the watershed which is important for controlling the release of meltwater to the spring freshet and controls the development of the seasonal active-layer. In previous years, we coupled the high-resolution snow conditions collected using RPAS with in-situ observations of stream discharge, evapotranspiration, and precipitation to create a daily snowmelt water budget for the Siksik Creek watershed (Walker 2018). In this study we were able to quantify the relative importance of snowcover across four dominant landcover types to understand how they control the availability of meltwater to the system. With further changes to the climate in this region including; changing precipitation, warmer temperatures and earlier spring melt dates, understanding the distribution of snowcover will be important to understand how the streamflow regime will shift. Using this combination of RPAS remote sensing and hydrological measurements we will be able to advance our understanding of the complex interaction between climate-vegetation-snow in attempts to improve our ability to model future conditions.
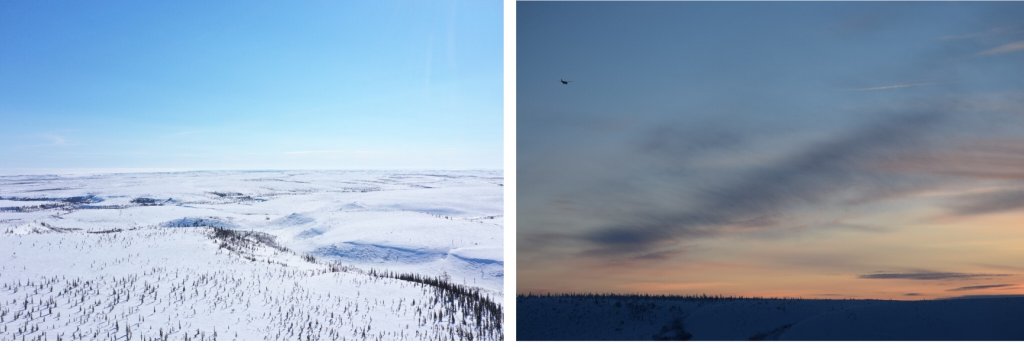
Right: The TVCSnow radar system aboard a small manned aircraft flies off into the winter sunset. Our RPAS surveying provides valuable snowcover data to help improve current and future earth observing systems.
RPAS application for snow: Challenges
Conducting RPAS flights during the harsh Arctic winter is not without its challenges. Availability of daylight, or lack thereof, during the polar winter presents a significant issue for optical remote sensing that cannot easily be overcome using survey-grade RPAS systems. Variable lighting results in unusable images or poor stitching by the SfM software. In the future, these issues may be overcome through integration of multispectral sensors. However, for most flight dates across the 2018-19 winter period lighting conditions were sufficient to successfully map the snow surface elevation from above. Over-exposure of images resulting from the high albedo of snowcover during the spring period presents challenges, but this is easily overcome by manually adjusting the camera internal settings.
Poor lighting was not the only environmental limitation to this study. Strong arctic winds periodically reached an excess of 40km/hr and daytime high temperatures were well below the manufacturer recommended operating temperature. For future airborne campaigns we recommended flight operations be suspended when winds speeds exceed 30km/hr as the quality of the imagery often degrades, and battery life is greatly diminished in the cold, with the latter overcome through applying creative heating strategies for the RPAS, batteries, Laptop and radio.
About the Author
Branden Walker is a Research Associate in the AHRG, located in the Cold Regions Research Centre at Wilfrid Laurier University, Waterloo, Ontario. His research addresses how Arctic hydrological systems are changing under a rapidly warming climate. His research combines traditional cold regions hydrological techniques with remote sensing to better understand snow and stream hydrological regimes. Beyond research, Branden is also the Operations Manager for the Trail Valley Creek Research Station located in the Western Arctic. When not in the field he enjoys the outdoors and is an avid supporter of science communication. Follow closely with his ongoing research in the Canadian Western Arctic @Branden0Walker
Plus comme ça:
- Faits nouveaux sur la « perle du Nord » : le Laboratoire de recherche atmosphérique dans l’environnement polaire du Canada (PEARL)
- Position de la SCMO relativement au rapport spécial du GIEC sur le réchauffement planétaire de 1,5 °C
- Déclaration de consensus du Centre climatologique régional de l’Arctique : Température
Arctique, Branden Walker, cartographie de la neige, drones, toundra