
Une entrevue avec océanographe Susan Allen à propos de la mer des Salish
Marek : Bonjour, je m’entretiens aujourd’hui avec la professeure Susan Allen de la faculté des sciences de la Terre, des océans et de l’atmosphère de l’Université de la Colombie-Britannique sur l’un de ses nombreux sujets de recherche : la mer des Salish. Qu’est-ce que la mer des Salish? Pouvez-vous me la décrire?
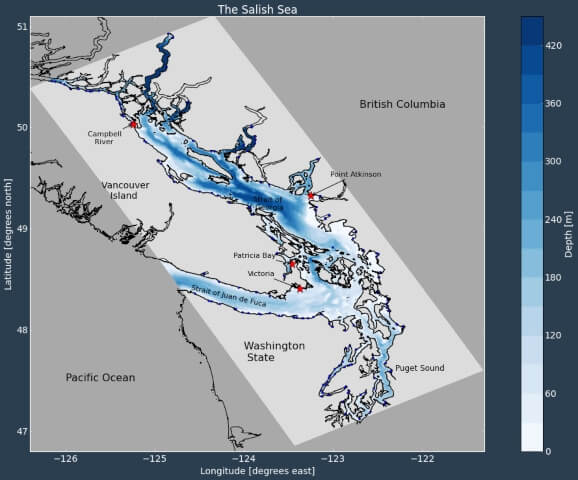
Susan : Si je ne me trompe pas, la mer des Salish n’est pas un terme officiel de géographie et n’a donc pas de définition officielle. Par exemple, j’ai lu un article récemment dans lequel la mer des Salish ne comprenait que Puget Sound et une petite partie du détroit de Juan de Fuca; c’est la plus petite superficie que j’ai vue pour cette mer. Selon moi, la mer des Salish commence à l’embouchure du détroit de Juan de Fuca, couvre tout Puget Sound, tout le détroit de Georgie et va jusque dans une partie du détroit de Johnstone. Sur la plupart des cartes que j’ai vues, la mer s’arrête à peu près à l’extrémité nord du détroit de Georgie.
Marek : D’accord. Puisque l’expression est relativement nouvelle, pouvez-vous nous expliquer brièvement son origine?
Susan : La plupart des bassins que je viens de nommer le sont d’après des « pionniers ». C’est le nom d’un roi ou d’un explorateur, vrai? Et il y a une forte croyance ici que le lieu était habité bien avant. On y reviendra à la prochaine question, mais il vaut mieux utiliser les termes que les Autochtones d’ici employaient. Je trouve aussi que les termes des Autochtones sont souvent plus en phase avec l’océanographie physique. Ils regroupent des éléments qui doivent en fait être regroupés du point de vue de l’océanographie physique, alors que la terminologie des pionniers sépare des éléments pour des raisons géopolitiques, pas pour des raisons océanographiques.
Marek : D’accord, donc, historiquement, combien de groupes ont habité autour de la mer des Salish?
Susan : Donc le mot Salish vient des peuples Salish de la côte, qui comprennent plus qu’un peuple, mais constitue un seul groupe linguistique. Le nombre de groupes différents ayant habité autour de la mer des Salish est estimé à des douzaines. Et donc, à Vancouver même, il y a trois groupes, les Musqueam, les Squamish et les Tsleil-Waututh. Mais il ne faut pas chercher longtemps pour en trouver d’autres, dans une direction ou une autre. Et même, au sud, il y a aussi les Lummi. Donc il y en a beaucoup, probablement deux douzaines.
Marek: Hello, I am speaking with Professor Susan Allen, from the University of British Columbia’s Department of Earth, Ocean, and Atmospheric Science about one of her many research interests: the Salish Sea. What is the Salish sea? Can you tell me a bit about it?
Susan: The Salish Sea, I believe, is not actually an official geographic term and therefore it does not have an official definition. For example, I recently saw a paper where the Salish Sea only included Puget Sound and a little bit of the Strait of Juan de Fuca, which is the smallest Salish Sea I’ve seen.My Salish Sea goes from the mouth of the Strait of Juan de Fuca, all of Puget Sound, all of the Strait of Georgia and up into some of the Johnstone Strait. Most maps I’ve seen kind of cut it off at the north end of the Strait of Georgia.
Marek: OK. Since it is kind of a new-ish term, can you maybe tell me a little bit about how the term came to be used?
Susan: Most of the terms I just used for the individual basins are “settler” terms. They’re named after kings and discoverers, and there’s a very strong feeling here that the place was settled before that. It will also come up in the next question, but we should use the terms that the Indigenous Peoples here used. I’ve often also found that the Indigenous Peoples’ terms are more in tune with the physical oceanography. They group things together that actually should be grouped together from the physical oceanography point of view, whereas the settler terminology breaks things up that that are broken up for geopolitical reasons, but not for oceanographic reasons.
Marek: OK, so then historically, how many groups lived around the Salish seashore?
Susan: So the term Salish comes from the Coastal Salish people, which are not a single people, but are seen as a single linguistic group. The estimates of the number of different groups that lived around the Salish sea, it’s like dozens. In Vancouver itself we have three groups: the Musqueum, the Squamish and the Tsleil-Waututh. And in the South, you’ve got the Lummi, so there’s there’s a large number, probably a couple dozen.
Marek: Today, the major population centre on the Canadian side is Vancouver and on the American side it’s Seattle. So I am wondering whether the Indigenous groups are urban Indigenous Peoples, or do they have land associated with each group?
Susan: Vancouver has a large number of Indigenous peoples from the region, but also from the whole province. It’s not just the coastal Salish that are in Vancouver as urban people. I’m pretty sure all these groups have land that they currently have as a reservation. And then they have claims or unceded territories that very much cover the whole region and overlap.
Marek: So in terms of population centres, people who might not know the West Coast well, apart from Vancouver. What what do we have?
Susan: Well certainly Victoria, which is actually the capital of British Columbia, is on the Juan de Fuca Strait and that’s part of the Salish sea. And then we have a smaller centres like Nanaimo and then great places to fish like Campbell River. Interesting places like Powell River, but they’re very much smaller. And then, of course, when I say Vancouver, we are not amalgamated, like say Toronto is, so we have separate cities: North Vancouver, West Vancouver, Richmond, Burnaby, Delta, Surrey. So there’s a large number of these centres that are all kind of grouped together. If we go south of the border, we have Seattle and all its sister cities, including Tacoma, which takes us right down to the southern end of the Salish sea and Everett and Edmonds. Once we go out to the Juan de Fuca Strait, we have smaller communities like Port Angeles, which is right across from Victoria.
Marek: Right. So what about ecologically? Sounds like the Salish Sea covers everything from shallow delta type environments to fairly deep ocean. So what lives in there?
Susan: So everything lives in the Salish Sea, right? Now we’re seeing the return of the big mammals, which is just wonderful. More and more, we’re seeing bigger whales as well as the killer whales. We’re seeing humpback whales and we’re seeing more and more seals, more sea lions. So the Salish sea is actually recovering to some extent. It was over-fished and over-hunted, and we’re mainly seeing the recovery from those two things. Because of the fluid dynamics itself, the major part of the Salish Sea is not heavily polluted from the local region. Its CO2 has gone way up because of anthropogenic effects, but generally, it’s not badly polluted. That’s not because we’re wonderful people. It’s because of the dynamics of the system. In the actual harbours, of course, it is badly polluted, but we’re working on it. Most of the shores of the Salish Sea are very rocky and very vertical, but there are regions that are deltas. Unfortunately, those regions are ecologically tremendously important to the system with shallows, eelgrass beds, and juvenile or larval fish, but those are also the places we settled. So although the Salish Sea is huge and we’re only on a small part of it, we’re on one particular type of ecology, and so we have had an impact that way. For example, we’re down in eelgrass.
Marek: How did you come to model the Salish sea? Did it come from the physics, the ecology side, both?
Susan: So one of my real passions is how physics impacts and determines biology, at least at the lower levels. And so for me, they’re intertwined. And the other thing that’s really cool about biology and chemical tracers and other things that you can put in your ocean models is they’re great integrators and integrate some of the physical things we’re interested in that we don’t actually measure very well. So, for example, vertical velocities are difficult to get in a model very accurately. You think they’re kind of okay on average. But if you actually want to, look at phytoplankton growth because the vertical velocity determines how many nutrients get into the surface layer. If you don’t have your vertical velocities in your mixing right, you’re not going to get your productivity right. And so they’re very well tuned together and they actually work very nicely together. In some ways, the measurements that we can do up them because they’re natural integrators is really useful. I would say I come to model Salish Sea as an extremely interesting fluid dynamics place, but also ecologically very interesting as well. So from both. And it’s my backyard.
Marek: Right. That’s convenient. So, does the model you’ve developed have an actual name?
Susan: Yeah, it’s called SalishSeaCast.
Marek: Is it both an operational model and a scientific model in the sense that it provides predictions?
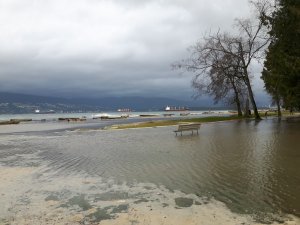
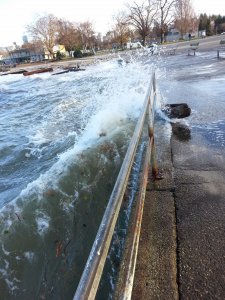
Susan: Yeah. So it runs operationally every day and it does storm surge prediction. The storm surge predictions are actually used by a bunch of people. There’s a wave model that runs operationally on top of it. The wave predictions [and the currents] are also being used by a bunch of people. Then it also produces a complete set of biological fields every day more in a nowcast than, I would say, a predictive sense. I find it super interesting, but I don’t know if anybody’s really using that portion. From a research point of view, yes, we are interested in how the Strait works. And so my postdoc, Elise Olson’s paper was just accepted. It shows the importance of the nutrient source from the North end of the Strait and how that drives a lot of productivity towards the North end, particularly coming straight down towards Baynes Sound, which is one of the biggest shellfish aquaculture sites. It’s a sensible place to put it right with ample nutrients. I’m looking at some of the mixing and and how the local mixing amongst the islands controls the exchange between the Strait of Georgia and the Juan de Fuca straight. And then we’re just submitting a paper on the impact of ocean acidification on the strait since the pre-industrial period.
Marek: Where do you put all that data?
Susan: Well, we have some of it on Compute Canada. But basically I built a fairly big system to hold that information. And we also put the operational stuff online for people to get from the server. So that’s how people get the storm surge or the currents or or whatever they want. It’s actually on a server they can download from.
Marek: Right. OK, so, I’m a modeller, you’re a modeller. We all know we like and don’t like about our models, but not everyone is a modeller. So maybe talk a little bit about if you could snap your fingers and magically improve one aspect of the model, what would it be? What are the sensitive spots? You mentioned one already: trying to get vertical velocities and mixing. Is that the key one or is there something else?
Susan: The model framework I use is NEMO, which was created in Europe as an open ocean global model. And, particularly groups in the U.K. have worked to make it useful as a coastal model. There has been a group in Italy using it to look at the Mediterranean. But one of the things that the version of the model I use doesn’t have is wetting and drying, which is relevant because of the huge tides in the Strait of Georgia. I can’t have any cell go to zero depth, so my minimum depth is four metres. So I would very much like to magically snap my fingers and get the new version 4.0, working with wetting and drying and with my favourite Z level coordinates. I don’t want to go to sigma coordinates which don’t play well with my super steep topography that I have in other places in the Strait of Georgia. So that’s what I would like, wetting and drying.
Marek: That’s a good one! Maybe talk a little bit about the computing side of it. I mean, one of the things people have talked about in the last few years is that the model has stopped being the challenge. Now it’s more data or visualisation. But as you just mentioned, for physical oceanography, some parts of the model quite often are still a challenge. So what’s the what’s the mixture of challenges. Is it is it the model? Is it the data? Sounds like you’ve got the data. What about visualisation processing?
Susan: Yeah, I would say that pretty much we are even with a lot of things and we are definitely data limited in a bunch of different ways. I’m starting a new project where we’re looking at the zooplankton, which are the little animals that eat the phytoplankton, and that’s a hugely complicated ecological structure.
Marek: And how do we take the two boxes that are in the model and actually compare the two? I think that’s always been a problem with models and observations; you know, you just don’t say, well, the model got this value and the observations got this value and they agree or disagree because they’re measuring two different things in two different ways. So how do you take that all into account?
Susan: There’s more data all the time, which is wonderful, but there are basic challenges with the modelling. We still find bugs in the original model that need to be fixed and have impacts. Visualisation and the physics and figuring out what’s going on.
Marek: Well, that’s fun, right? That’s the science. Like, how do you pull out of this system the things that are interesting and the ways to look at them. I think that’s always a challenge, but I think that’s always also the most fun science.
Susan: We run the model operationally through Ocean Networks Canada that managed to get us some time on various computers; and it’s now on the Arbutus cloud system. There’s another piece that runs on my local system and there’s one piece that runs on a UBC system. The research version is pretty much run on Complet Canada and we are very much appreciative of that time.
Marek: And how is the data processed?
Susan: So a lot of the operational stuff just goes straight onto the server and then we have some basic plots that are available on the website. And then how we process the data in the research sense depends on what we’re trying to do. So different people are doing all sorts of different things. So Ben’s been looking at upwelling in the Strait to try to understand the upwelling system. He’s used EOF analysis, scenario analysis. And idealised cases. He’s also used theory. So we put all the tools together. One of Rich Pawlowicz’s students is doing a lot of work with numerical drifters because they were using drifters for observations. So he’s been putting Lagrangian drifters in the model. I think that’s a very powerful technique.
Marek: So pretty much all the classic oceanographic tools, right? Well, you know, I could probably talk about the computing side for another half an hour or more, but maybe let’s switch to something different. How has the experience been with transferring knowledge down to stakeholder communities?
Susan: So I started this project funded by MEOPAR, the Marine Environmental Observation, Prediction and Response Network. And as part of that network, there is Response, which is the group that’s actually trying to look about what we do about Marine advance. And so I was fortunate to get in contact with Stephanie Chang, who’s a social science scientist at UBC, and she had a lot of experience already working with stakeholders. So I learnt a great deal from her. We’ve run quite a few stakeholder workshops and worked with those. And so how I deal with stakeholders actually determines which stakeholders. Because there’s a whole bunch of different stakeholders, right. So one of the stakeholders is Environment and Climate Change Canada. My model, SalishSeaCast, is being developed and should go into beta testing as an operational model for Environment Canada in the Fall of 2020, which is pretty exciting as one of the first oceanographic models from a university to go there. And so, you know, they’re scientists. And so it’s very straightforward, right? It’s scientists to scientists and and that’s no different. Then the next thing we could say, well, working with the local communities like the city of Vancouver; those kinds of people you end up working with – they’re professional planners and people like that. And I found that really enlightening because they’re no-nonsense. They know what they want. And it’s just a case of talking through the language differences. You know what you have and you just work through how you get it done. And then their people talk to my software engineer and it happens.
The workshops are really good because it takes a lot of time sometimes just to figure out what you have, what they have, how this works together. So patience, and I would say my most frustrating piece is actually you build up a really good relationship and you actually get really working with, and then they change jobs and you’ve got someone new. And that can be a little frustrating and hard because they do change jobs more than, you know, faculty, professors who’ve been in the same position for 30 years now. And then the last piece is I have done a little bit of talking to the Tsleil-Waututh people, and that has been absolutely wonderful. They have their own scientists. They hire their own scientists. So the communication is scientists-to-scientists and then their scientists take it to to the Indigenous community. I would say my biggest frustration is my model doesn’t actually go into Tsleil-Waututh. But I would really love to go further with that, because I think their perceptions and what they want to do is really exciting.
Marek: OK, well, so look ahead for me a little bit. What’s the what’s the future of Salish Sea research?
Susan: So there’s a couple of really cool things about SalishSeaCast because we’ve made it so available and because there’s a large number of people at UBC doing all sorts of things in the region. We’ve got a large number of researchers not directly related to me that are actually working on it and using the fields as part of their ability to understand ecology, biodiversity, and we haven’t even talked about the fact we’re working on an oil spill model. So, you know, there’s a large number of applications that are happening, but I also think it’s proving to be a very special testbed for testing a whole bunch of things that are probably happened in other coastal systems. But coastal systems are complicated and you need to resolve them to really understand what’s going on. And this is a way you can test ideas and test things. So I think it’s going in all sorts of directions. It’s getting further up the food chain, if you want to think about that, but also getting more into the fundamentals of the fluid dynamics and the data that Rich Pawlowicz is collecting right now will allow us to test it at a higher level. DFO is going to create nested grids inside the SalishSeaCast model, which will then allow us to get into the harbour and things like that. So I think that will be interesting too.
Marek: OK, neat, well, this isn’t really a spoken word question, but what I’m going to do is to ask for the readers if you could provide some sort of extra reading for all the keeners who would like to read a little bit more. Thank you Susan for speaking with me.
About the Author
Susan Allen, Professor at the University of British Columbia (UBC), is a physical oceanographer who uses models to understand, and predict coastal oceanographic processes and biogeochemical-physical interactions. Her longest standing obsession has been the flow over and around topography and its implications on biology and chemistry of the surrounding waters.
Susan was modelling coordinator for the Canadian GEOTRACES project and is one of two Theme Leads for Canada’s Marine Environment Observation, Prediction and Response (MEOPAR) Network of Excellence. Her group runs a three-dimensional coupled bio-chem-physical model daily and forecasts 36 hours into the future. With MEOPAR she has collaborated with social scientists and stakeholders and advanced open, accessible and reproducible science.
At UBC she teaches physical oceanography, atmospheric science and numerical techniques. Twenty MSc and nine PhD students have graduated under her supervision. She has received the President’s Prize and the Saucier Applied Oceanography Prize from the Canadian Meteorological and Oceanographic Society.
More information about Susan’s research can be found here:
- For today’s storm surge forecast, click here.
- See the Evaluation Results Board from Nowcast. here.
- See an example movie, and select Surface Nitrate from the drop down menu.
- Publications can be found here
Did you enjoy this article? Subscribe here to get the latest from the CMOS Bulletin!
Marek Stastna, mer des Salish, SalishSeaCast, storm surge forecast, Susan Allen